Unlock a world of possibilities! Login now and discover the exclusive benefits awaiting you.
- Qlik Community
- :
- Forums
- :
- Analytics
- :
- New to Qlik Analytics
- :
- Re: create a new field
- Subscribe to RSS Feed
- Mark Topic as New
- Mark Topic as Read
- Float this Topic for Current User
- Bookmark
- Subscribe
- Mute
- Printer Friendly Page
- Mark as New
- Bookmark
- Subscribe
- Mute
- Subscribe to RSS Feed
- Permalink
- Report Inappropriate Content
create a new field
Dear All
I need to create a new field namely “DESCRIPTION’ using the below given field
“BAL_ACCT_CODE AS CACC”.
BAL_ACCT_CODE AS CACC comprise the appended accounts codes, which should bear the following particulars. In addition by using the codes 10100 minus 15600 we should arrive at the wording “Total_Net_Assest”, ensure that the “Total_Net_Assest” wording should appear in the “DESCRIPTION’ field.
AN ESSENTIAL FIELD “DESCRIPTION’ | BAL_ACCT_CODE AS CACC | AMOUNT |
FIXED ASSETS | 10100 | 626,043,313 |
DEPRECIATION | 15600 | -8,282,434 |
TOTAL_NET_ASSEST (10100-15600) | 634,325,747 | |
INVESTMENT EXTERNAL | 22035 | 2,490,625 |
STATIONERY STOCK | 30010 | 25,900,833 |
ADVANCES & PRE-PAYMENTS | 33000 | 31,575,750 |
TRADE DEBTORS | 31000 | 4,122,317,827 |
RETURN CHEQUES | 32000 | 17,401,462 |
STAFF LOANS | 32600 | 42,619,432 |
MY SCRIPT
BS:
LOAD BAL_BRANCH_CODE AS BCOD,
BAL_ACCT_CODE AS CACC,
//BAL_ACCT_YEAR AS TRAN_DATE,
DATE(Floor(MonthStart(MakeDate(BAL_ACCT_YEAR,BAL_ACCT_PERIOD)))) as TRAN_DATE,
//BAL_ACCT_PERIOD,
BAL_HC_DBBAL,
BAL_HC_CRBAL
FROM
G:\SGR\QLICK VIEW\QVD\BLSHEET_CU_GL_BALANCE.QVD
(qvd);
Sagara
- Mark as New
- Bookmark
- Subscribe
- Mute
- Subscribe to RSS Feed
- Permalink
- Report Inappropriate Content
what is your expected output??
- Mark as New
- Bookmark
- Subscribe
- Mute
- Subscribe to RSS Feed
- Permalink
- Report Inappropriate Content
i want get a pivot table as follows
DESCRIPTION AMOUNT
FIXED ASSETS 626,043,313
DEPRECIATION -8,282,434
TOTAL_NET_ASSEST 634,325,747
INVESTMENT EXTERNAL 2,490,625
SAGARA
- Mark as New
- Bookmark
- Subscribe
- Mute
- Subscribe to RSS Feed
- Permalink
- Report Inappropriate Content
do you have any mapping between BAL_ACCT_CODE and description field
- Mark as New
- Bookmark
- Subscribe
- Mute
- Subscribe to RSS Feed
- Permalink
- Report Inappropriate Content
Hi,
You can try like this
Temp:
LOAD * INLINE [
DESCRIPTION, CACC, AMOUNT
FIXED ASSETS, 10100, 626043313
DEPRECIATION, 15600, -8282434
INVESTMENT EXTERNAL, 22035, 2490625
STATIONERY STOCK, 30010, 25900833
ADVANCES & PRE-PAYMENTS, 33000, 31575750
TRADE DEBTORS, 31000, 4122317827
RETURN CHEQUES, 32000, 17401462
STAFF LOANS, 32600, 42619432
];
Dim:
load * Inline [
Dim
1
2
];
Chart dim:
=if(Dim=1,DESCRIPTION,'TOTAL_NET_ASSEST')
exp:
if(Dim=1,sum(AMOUNT), sum({<CACC={'10100'}>}AMOUNT)-sum({<CACC={'15600'}>}AMOUNT))
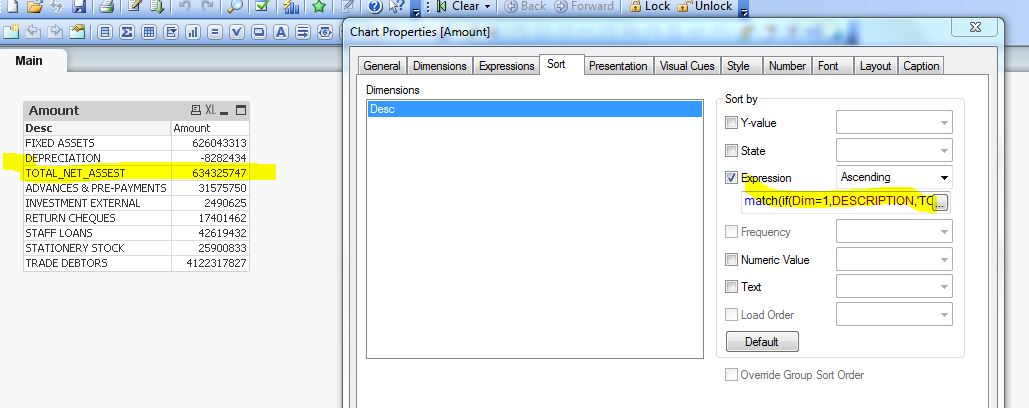
custom sort exp:
match(if(Dim=1,DESCRIPTION,'TOTAL_NET_ASSEST'),'FIXED ASSETS','DEPRECIATION','TOTAL_NET_ASSEST','ADVANCES & PRE-PAYMENTS','INVESTMENT EXTERNAL','RETURN CHEQUES','STAFF LOANS','STATIONERY STOCK','TRADE DEBTORS')
- Mark as New
- Bookmark
- Subscribe
- Mute
- Subscribe to RSS Feed
- Permalink
- Report Inappropriate Content
Dear Devarasu
thanks for your reply, can i help small favor,
what place insert given below
Chart dim:
=if(Dim=1,DESCRIPTION,'TOTAL_NET_ASSEST')
sagara
- Mark as New
- Bookmark
- Subscribe
- Mute
- Subscribe to RSS Feed
- Permalink
- Report Inappropriate Content
In your pivot chart create calculated dimension using above expression which i mentioned. Thanks
- Mark as New
- Bookmark
- Subscribe
- Mute
- Subscribe to RSS Feed
- Permalink
- Report Inappropriate Content
Hi,
PFA, Same output using qliksense. (PS: update your custom sorting based on your requirement.)
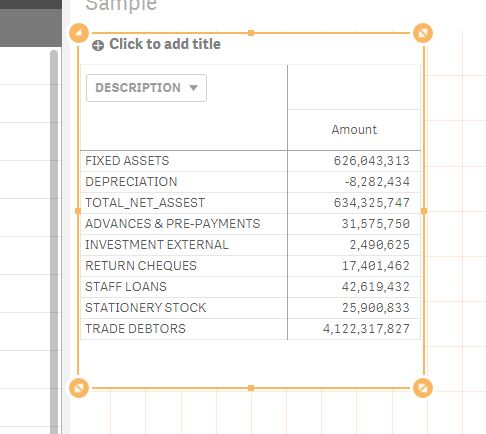
If your issue got resolved try to close this thread by marking as correct. tks
Thanks
Deva
- Mark as New
- Bookmark
- Subscribe
- Mute
- Subscribe to RSS Feed
- Permalink
- Report Inappropriate Content
HI,
I would advised having a look at this
How IntervalMatch Solved My Profit and Loss Dilemma
I have used this approach to make both Balance sheet and Profit and loss reports
Mark