Unlock a world of possibilities! Login now and discover the exclusive benefits awaiting you.
- Qlik Community
- :
- Forums
- :
- Analytics
- :
- New to Qlik Analytics
- :
- difference b/w Mekko Chart and Block Chart ?
- Subscribe to RSS Feed
- Mark Topic as New
- Mark Topic as Read
- Float this Topic for Current User
- Bookmark
- Subscribe
- Mute
- Printer Friendly Page
- Mark as New
- Bookmark
- Subscribe
- Mute
- Subscribe to RSS Feed
- Permalink
- Report Inappropriate Content
difference b/w Mekko Chart and Block Chart ?
Please Answer anyone
Regards,
Hussain.
Accepted Solutions
- Mark as New
- Bookmark
- Subscribe
- Mute
- Subscribe to RSS Feed
- Permalink
- Report Inappropriate Content
Hi Hussain,
Charts are graphical representations of numerical data. ... Mekko charts present data using variable width bars. They can display up to three levels of data in a two-dimensional chart. Mekko charts are useful in such areas as market analysis
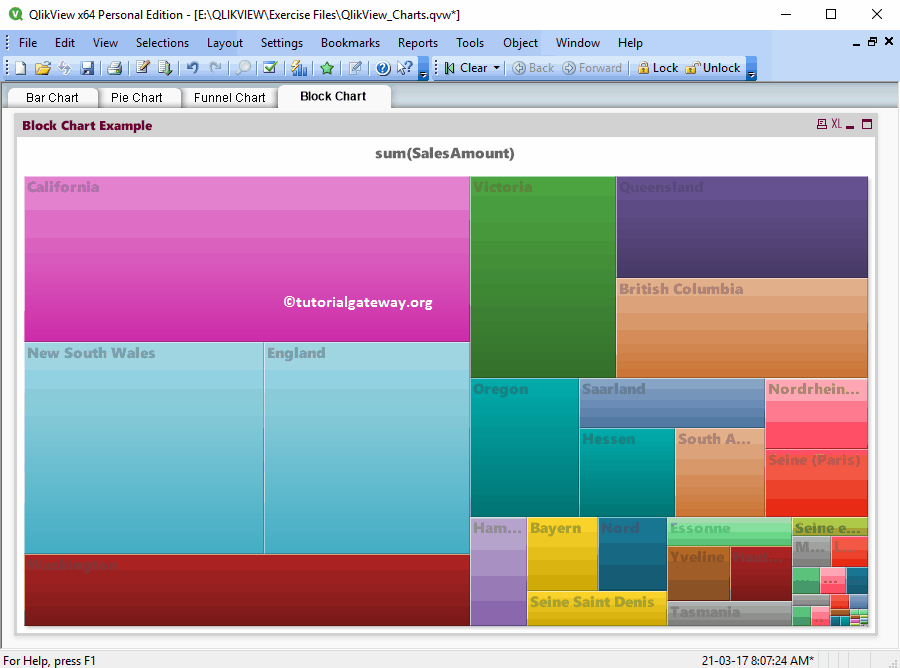
Block Chart. Charts are graphical representations of numerical data. ... The block chart shows the relation between expression values as blocks of varying area. Up to three dimensions can be displayed, where each dimension is subdivided into sub-blocks.
The Block chart shows the relation between expression values as blocks of varying area. From a display standpoint it is related to the pie chart. The chart may be shown with either segment height/width or segment area proportional to data. It is also possible to draw the chart with equal segment heights/widths, disregarding data points.
for more Details go through these links, It's might be helpful for you.
https://www.think-cell.com/en/support/manual/mekko.shtml
https://www.tutorialgateway.org/block-chart-in-qlikview/
Regards,
Vinayak
- Mark as New
- Bookmark
- Subscribe
- Mute
- Subscribe to RSS Feed
- Permalink
- Report Inappropriate Content
Hi Hussain,
Charts are graphical representations of numerical data. ... Mekko charts present data using variable width bars. They can display up to three levels of data in a two-dimensional chart. Mekko charts are useful in such areas as market analysis
Block Chart. Charts are graphical representations of numerical data. ... The block chart shows the relation between expression values as blocks of varying area. Up to three dimensions can be displayed, where each dimension is subdivided into sub-blocks.
The Block chart shows the relation between expression values as blocks of varying area. From a display standpoint it is related to the pie chart. The chart may be shown with either segment height/width or segment area proportional to data. It is also possible to draw the chart with equal segment heights/widths, disregarding data points.
for more Details go through these links, It's might be helpful for you.
https://www.think-cell.com/en/support/manual/mekko.shtml
https://www.tutorialgateway.org/block-chart-in-qlikview/
Regards,
Vinayak
- Mark as New
- Bookmark
- Subscribe
- Mute
- Subscribe to RSS Feed
- Permalink
- Report Inappropriate Content
Hi,
When you open qlikview, you'll be able to see examples, search for "data visualization".
You'll be able to see the details with samples.