Unlock a world of possibilities! Login now and discover the exclusive benefits awaiting you.
- Qlik Community
- :
- Forums
- :
- Analytics
- :
- New to Qlik Analytics
- :
- expenses stacked bar side-by-side Income bar in ql...
Options
- Subscribe to RSS Feed
- Mark Topic as New
- Mark Topic as Read
- Float this Topic for Current User
- Bookmark
- Subscribe
- Mute
- Printer Friendly Page
Turn on suggestions
Auto-suggest helps you quickly narrow down your search results by suggesting possible matches as you type.
Showing results for
Anonymous
Not applicable
2016-10-11
08:03 AM
- Mark as New
- Bookmark
- Subscribe
- Mute
- Subscribe to RSS Feed
- Permalink
- Report Inappropriate Content
expenses stacked bar side-by-side Income bar in qlik sense
Hi,
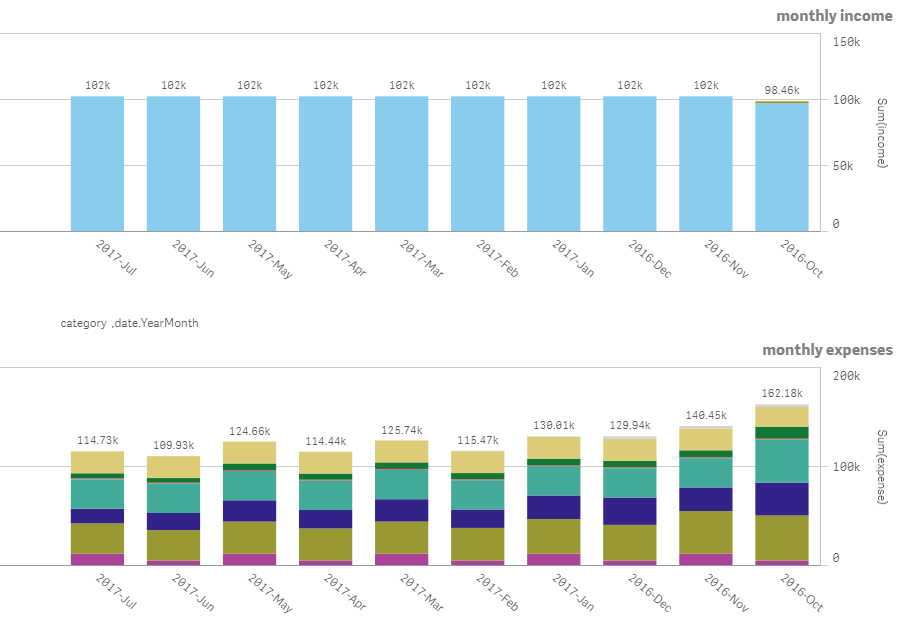
Is this possible to combine the below two charts into one with 2 columns for each month somehow in qlik sense?
I am trying to use a bar chart to compare monthly expenses with monthly income where the expenses bar is a stacked bar made of the different expense categories (see bottom chart).
Is it possible to define a partially stacked bar chart where some items have their own columns and some are stacked together?
461 Views
0 Replies
Community Browser