Unlock a world of possibilities! Login now and discover the exclusive benefits awaiting you.
- Qlik Community
- :
- Forums
- :
- Analytics
- :
- New to Qlik Analytics
- :
- map values to survey answers
- Subscribe to RSS Feed
- Mark Topic as New
- Mark Topic as Read
- Float this Topic for Current User
- Bookmark
- Subscribe
- Mute
- Printer Friendly Page
- Mark as New
- Bookmark
- Subscribe
- Mute
- Subscribe to RSS Feed
- Permalink
- Report Inappropriate Content
map values to survey answers
Hello,
new to Qlik Sense, I'm trying to visualize survey data (likert) with a range of Strongly agree to Strongly disagree (1-5) and calculating a weighted mean accounting for the number of responses in each. But I'm having trouble assigning values to the answers?
this is an example of what I'm trying to accomplish:
Strongly Agree = 5 -- 10 responses
Agree = 4 -- 8 responses
Disagree = 3 -- 5 responses
Strongly Disagree = 2 -- 4 responses
Not Applicable = 1 -- 5 responses
I **think I have to create a new field..but not sure how or where..(INLINE??), then after that use that field to sort by value, and use a weighted formula....but once again, kind of lost and overwhelmed!
many thanks
- Tags:
- survey values
Accepted Solutions
- Mark as New
- Bookmark
- Subscribe
- Mute
- Subscribe to RSS Feed
- Permalink
- Report Inappropriate Content
Hi Adrian,
Inline table is one of the easy solution. Go to the data load editor (script editor) and add the below code
Load * Inline [
Response, Value
Strongly Agree, 1
Agree, 2
Disagree, 3
Strongly Disagree, 4
Not Applicable, 5
];
Make sure the column name is same as per your existing data model. So it will automatically linked with corresponding column. Also you can load this from external files like csv, Excel.
Regards,
Prabhu Appu
- Mark as New
- Bookmark
- Subscribe
- Mute
- Subscribe to RSS Feed
- Permalink
- Report Inappropriate Content
I'm afraid I don't understand your explanation. How come the intervals overlap?
Not applicable 1--5
Strongly Disagree 2--4
Perhaps you can post a small qlikview document that illustrates the question.
talk is cheap, supply exceeds demand
- Mark as New
- Bookmark
- Subscribe
- Mute
- Subscribe to RSS Feed
- Permalink
- Report Inappropriate Content
Hi Adrian,
Inline table is one of the easy solution. Go to the data load editor (script editor) and add the below code
Load * Inline [
Response, Value
Strongly Agree, 1
Agree, 2
Disagree, 3
Strongly Disagree, 4
Not Applicable, 5
];
Make sure the column name is same as per your existing data model. So it will automatically linked with corresponding column. Also you can load this from external files like csv, Excel.
Regards,
Prabhu Appu
- Mark as New
- Bookmark
- Subscribe
- Mute
- Subscribe to RSS Feed
- Permalink
- Report Inappropriate Content
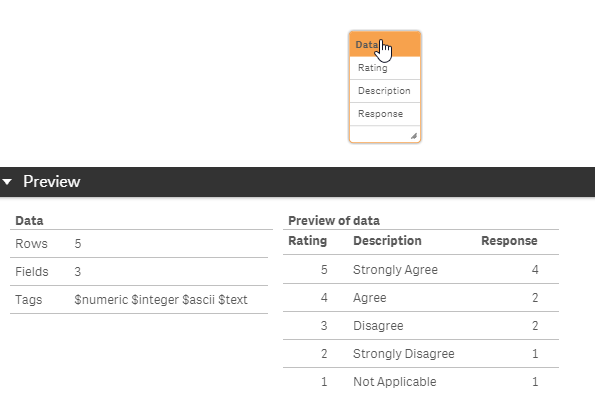
Hi Adrian,
Try this:

Say you have a table with the surveys like this:
Dim:
Mapping load * inline [
Rating,Description
1,Not Applicable
2,Strongly Disagree
3,Disagree
4,Agree
5,Strongly Agree
];
Tempdata:
load Rating,
applymap('Dim',Rating,null()) as Description,
Response;
Load Rating,count(Rating) as Response
group by Rating;
load * inline [
Customer, Rating
A,5
B,2
C,3
D,4
E,5
F,5
G,3
H,5
I,4
J,1
];
NoConcatenate
[Data]:
Load * Resident Tempdata order by Rating desc;
Thanks and Regards,
Sangram Reddy.
- Mark as New
- Bookmark
- Subscribe
- Mute
- Subscribe to RSS Feed
- Permalink
- Report Inappropriate Content
I see! This makes sense, I'll give this a try!
- Mark as New
- Bookmark
- Subscribe
- Mute
- Subscribe to RSS Feed
- Permalink
- Report Inappropriate Content
this is a little complex I'll go through it and try to understand it a bit.
to be a little more clear on the responses/intervals.
e.g. one survey question is "The instructor is clear and concise."
in that question, there were:
10 people that chose Strongly Agree
Agree - 8
Disagree - 5
Strongly Disagree - 4
Not Applicable - 5
etc..
I want to be able to come up with a mean score for that question.
- Mark as New
- Bookmark
- Subscribe
- Mute
- Subscribe to RSS Feed
- Permalink
- Report Inappropriate Content
Hi Adrian,
If you need a mean score, you can simply make use of the AVG(Field) function to get the desired result.
Thanks and Regards,
Sangram Reddy.