Unlock a world of possibilities! Login now and discover the exclusive benefits awaiting you.
Announcements
Accelerate Your Success: Fuel your data and AI journey with the right services, delivered by our experts.
Learn More
- Qlik Community
- :
- Forums
- :
- Analytics
- :
- New to Qlik Analytics
- :
- want to implement an inbuilt functionality for a c...
Options
- Subscribe to RSS Feed
- Mark Topic as New
- Mark Topic as Read
- Float this Topic for Current User
- Bookmark
- Subscribe
- Mute
- Printer Friendly Page
Turn on suggestions
Auto-suggest helps you quickly narrow down your search results by suggesting possible matches as you type.
Showing results for
Anonymous
Not applicable
2018-10-11
08:03 AM
- Mark as New
- Bookmark
- Subscribe
- Mute
- Subscribe to RSS Feed
- Permalink
- Report Inappropriate Content
want to implement an inbuilt functionality for a custom component
Hi,
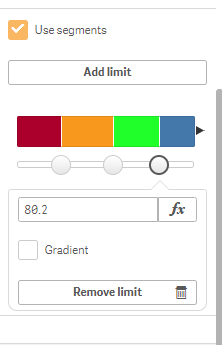
I am new to Qlik Sense and I am using Guage Chart and there if I check "Use Segments" I could see I can add/remove limit also there is color picker for slider and I can select different color for different range. PFB the image.
I want to implement same functionality as Gauge chart for a custom extension, but I am not able to find any helpful reference.
So, if anyone have a good approach to achieve it that will be really helpful.
Thanks in advance.
233 Views
0 Replies
Community Browser