Unlock a world of possibilities! Login now and discover the exclusive benefits awaiting you.
- Qlik Community
- :
- Forums
- :
- Analytics
- :
- New to Qlik Analytics
- :
- Re: Accumulation of Months
- Subscribe to RSS Feed
- Mark Topic as New
- Mark Topic as Read
- Float this Topic for Current User
- Bookmark
- Subscribe
- Mute
- Printer Friendly Page
- Mark as New
- Bookmark
- Subscribe
- Mute
- Subscribe to RSS Feed
- Permalink
- Report Inappropriate Content
Accumulation of Months
Hello world,
I need your help because I have to visualize the information of the value of the account that accumulates month by month, but the information is not displayed as I want.

I attach the qvf in case you need it.
- Mark as New
- Bookmark
- Subscribe
- Mute
- Subscribe to RSS Feed
- Permalink
- Report Inappropriate Content
what is not correctly accumulated? where? and how would u like it to be?
Some better explanation maybe? so that we can fully understand ur needs and thus could better help u?
- Mark as New
- Bookmark
- Subscribe
- Mute
- Subscribe to RSS Feed
- Permalink
- Report Inappropriate Content
Hi, I would like it to be like that
- Mark as New
- Bookmark
- Subscribe
- Mute
- Subscribe to RSS Feed
- Permalink
- Report Inappropriate Content
Still don't fully understand what u have and what u want;
but if u have sum(Measure) for example and as a dimension; Month
and u want to show the accumalted Measure ; alter it from
sum(Measure)
to
rangesum(abov(sum(Measure),0,rowno()))
- Mark as New
- Bookmark
- Subscribe
- Mute
- Subscribe to RSS Feed
- Permalink
- Report Inappropriate Content
It doesn't work.
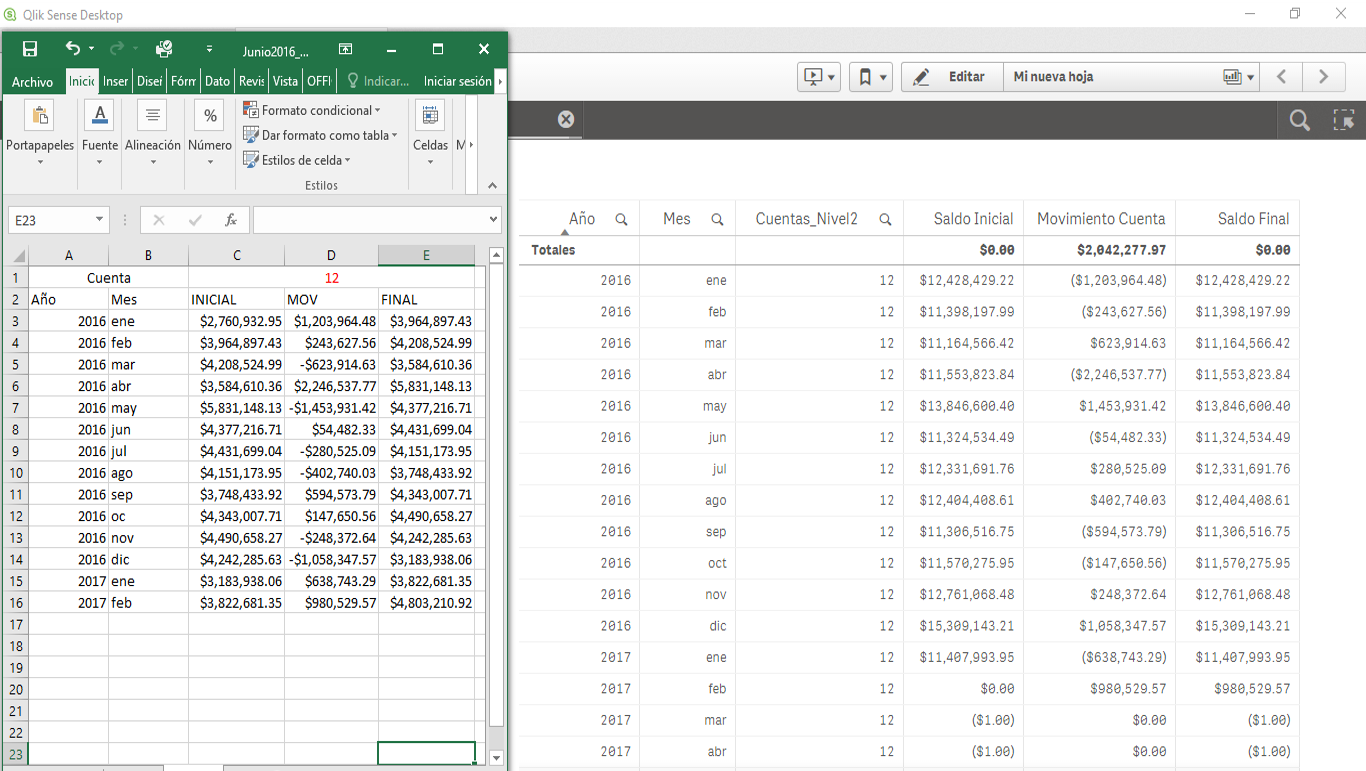
I have a value called Saldo_Anterior, this value plus other called Movimiento_Cuenta is equal to Saldo_Final, then that Saldo_Final in January 2016 gonna be Saldo_Anterior for February 2016 and then, this plus the respective Movimiento_Cuenta gonna be Saldo_Final and that procedure is repetitive until the selected month. Always it starts in this way, for all Counts that I have.
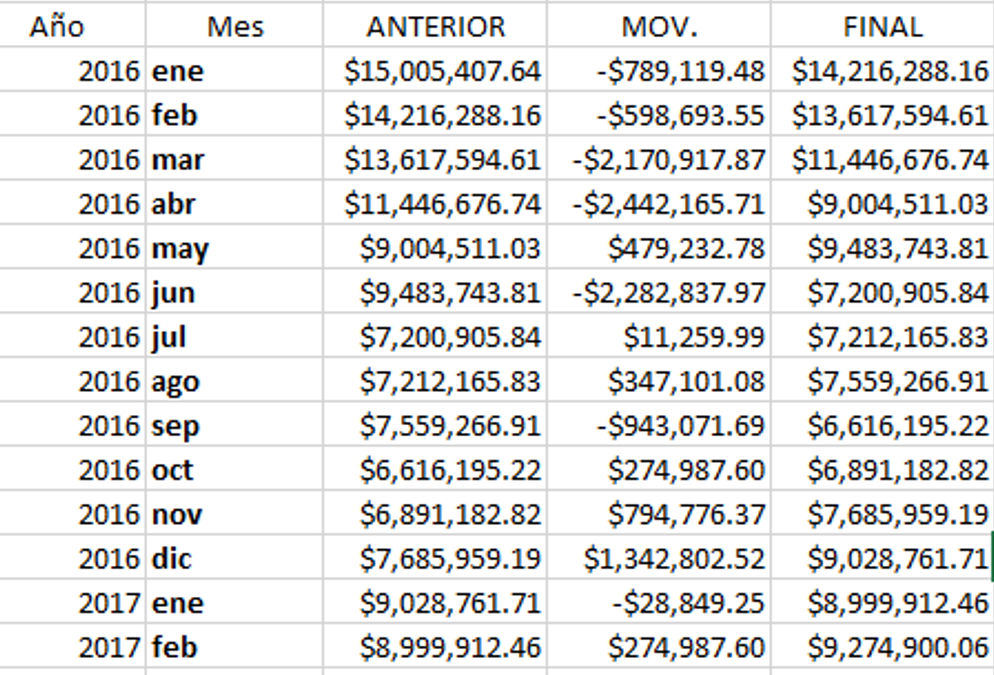
The result, the total of sum is correct, but I need to visualize the information like I have in Excel. In Qlik, the table is visualizing Movimiento_Cuenta in the three columns measures, so the information is incorrect.
- Mark as New
- Bookmark
- Subscribe
- Mute
- Subscribe to RSS Feed
- Permalink
- Report Inappropriate Content
I applied your suggestion with rangesum but it gets me others values