Unlock a world of possibilities! Login now and discover the exclusive benefits awaiting you.
- Qlik Community
- :
- Forums
- :
- Analytics
- :
- New to Qlik Analytics
- :
- Re: Alternate Dimensions & Measures and the name ...
- Subscribe to RSS Feed
- Mark Topic as New
- Mark Topic as Read
- Float this Topic for Current User
- Bookmark
- Subscribe
- Mute
- Printer Friendly Page
- Mark as New
- Bookmark
- Subscribe
- Mute
- Subscribe to RSS Feed
- Permalink
- Report Inappropriate Content
Alternate Dimensions & Measures and the name of an object
Hi,
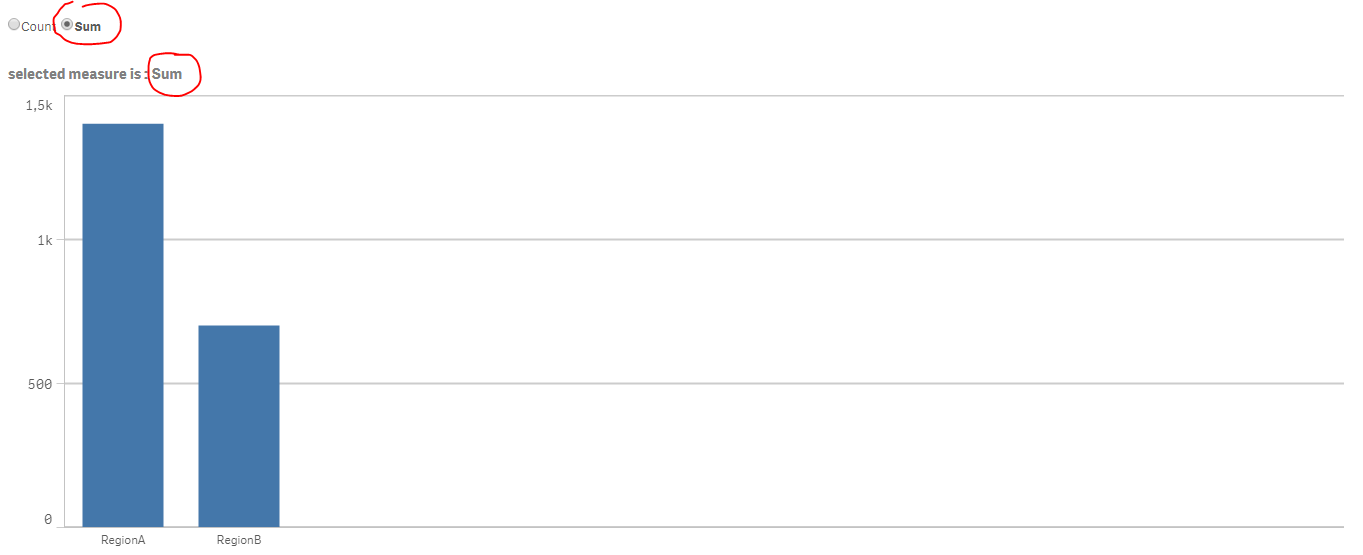
I used alternate measures in a graph. I turned on the labels and title. So you can switch easily between measures.
I want to show the measure also in the title of the graph. Is this possible?
Wouter
- « Previous Replies
-
- 1
- 2
- Next Replies »
Accepted Solutions
- Mark as New
- Bookmark
- Subscribe
- Mute
- Subscribe to RSS Feed
- Permalink
- Report Inappropriate Content
When you use the extension, The app becomes as attached:
you'll also find the extension attached.
Hope this helps !
- Mark as New
- Bookmark
- Subscribe
- Mute
- Subscribe to RSS Feed
- Permalink
- Report Inappropriate Content
Please post some sample app?
- Mark as New
- Bookmark
- Subscribe
- Mute
- Subscribe to RSS Feed
- Permalink
- Report Inappropriate Content

 ! !
! !
- Mark as New
- Bookmark
- Subscribe
- Mute
- Subscribe to RSS Feed
- Permalink
- Report Inappropriate Content
Someone any idea if I can use a dynamic title of the object as described above?
Please let me know.
Wouter
- Mark as New
- Bookmark
- Subscribe
- Mute
- Subscribe to RSS Feed
- Permalink
- Report Inappropriate Content
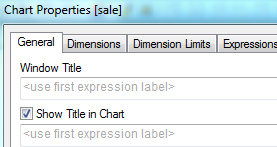
Try this,
- Mark as New
- Bookmark
- Subscribe
- Mute
- Subscribe to RSS Feed
- Permalink
- Report Inappropriate Content
Thanks. But I use Sense not View.
- Mark as New
- Bookmark
- Subscribe
- Mute
- Subscribe to RSS Feed
- Permalink
- Report Inappropriate Content
okay
- Mark as New
- Bookmark
- Subscribe
- Mute
- Subscribe to RSS Feed
- Permalink
- Report Inappropriate Content
Hi,
I don't know of a way to connect the Alternate Measures and a Title.
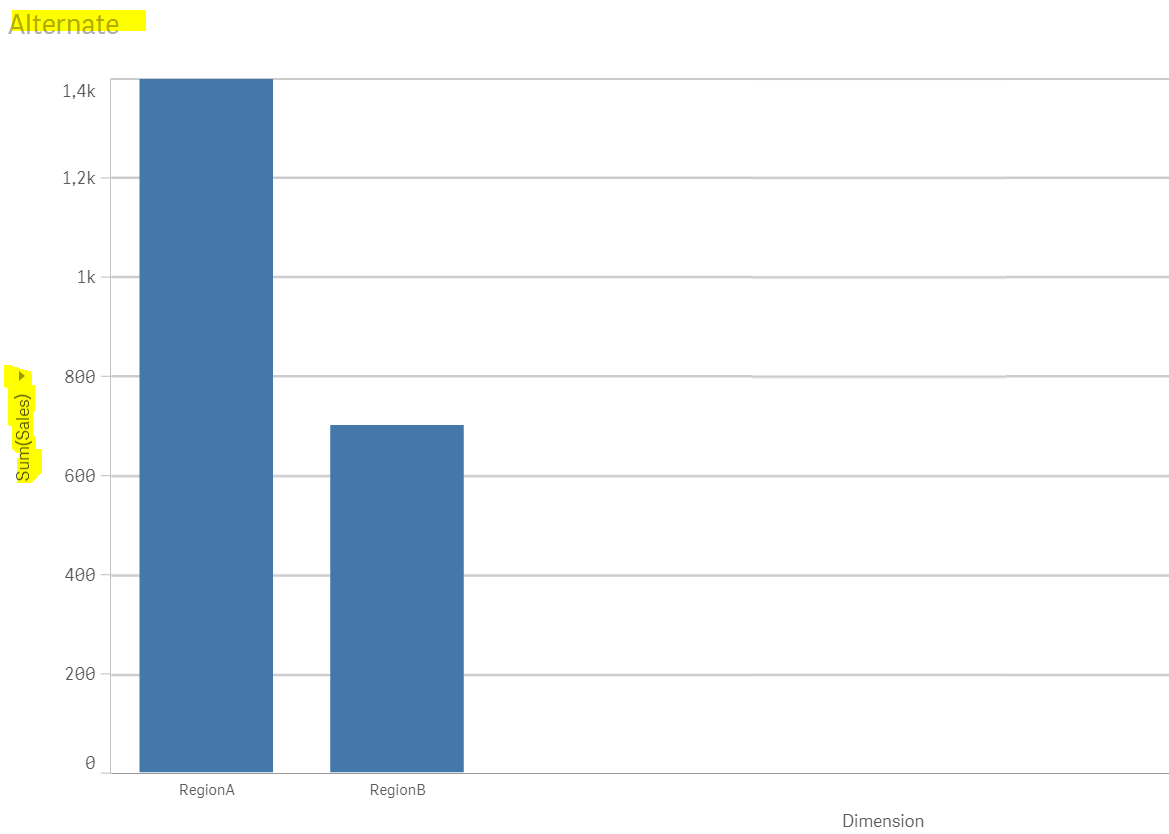
But, here's a cheeky workaround you could use.
Make your Bar chart to be a 'Horizontal ' bar chart with the x-axis position set to 'Top'. This will ensure that your users don't have to hunt-for or guess about the metric being displayed, it'll be there at the top, in their immediate field of view.
- Mark as New
- Bookmark
- Subscribe
- Mute
- Subscribe to RSS Feed
- Permalink
- Report Inappropriate Content
No It's not possible to do so,
But try this, see the attached App.
You can use the Styled List extension instead of the actual filter object:
GitHub - countnazgul/Qlik-Sense-Styled-Lists-Extension
Example of use:
Field timeframe containing 3 values. I want to have 'annuel' selected by default when I open the app

Result: when I open the sheet :
I find it selected:

- Mark as New
- Bookmark
- Subscribe
- Mute
- Subscribe to RSS Feed
- Permalink
- Report Inappropriate Content
When you use the extension, The app becomes as attached:
you'll also find the extension attached.
Hope this helps !
- « Previous Replies
-
- 1
- 2
- Next Replies »