Unlock a world of possibilities! Login now and discover the exclusive benefits awaiting you.
- Qlik Community
- :
- Forums
- :
- Analytics
- :
- New to Qlik Analytics
- :
- Re: Calculating Difference Current v. Prior Year
- Subscribe to RSS Feed
- Mark Topic as New
- Mark Topic as Read
- Float this Topic for Current User
- Bookmark
- Subscribe
- Mute
- Printer Friendly Page
- Mark as New
- Bookmark
- Subscribe
- Mute
- Subscribe to RSS Feed
- Permalink
- Report Inappropriate Content
Calculating Difference Current v. Prior Year
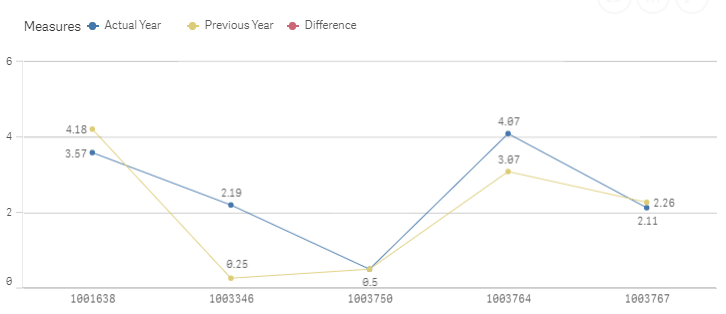
We need to calculate and use in a line graph the difference, based on ID, of the prior year v. current year.
So far, we have 2 years but this will need to work generally. Naturally the first year 2015 would have no "difference" record. The subsequent years would.
| ID | Year | Ratio |
| 1001638 | 2016 | 3.57 |
| 1001638 | 2015 | 4.18 |
| 1003346 | 2015 | 0.25 |
| 1003346 | 2016 | 2.19 |
| 1003750 | 2015 | 0.49 |
| 1003750 | 2016 | 0.50 |
| 1003764 | 2015 | 3.07 |
| 1003764 | 2016 | 4.07 |
| 1003767 | 2016 | 2.11 |
| 1003767 | 2015 | 2.26 |
We are calculating the ratio, currently, as a measure.
Is this all best done in the load script, or as a calculated measure?
- Mark as New
- Bookmark
- Subscribe
- Mute
- Subscribe to RSS Feed
- Permalink
- Report Inappropriate Content
Let's consider one row
ID Year Ratio 1001638 2016 3.57
Can you explain 3.57??
- Mark as New
- Bookmark
- Subscribe
- Mute
- Subscribe to RSS Feed
- Permalink
- Report Inappropriate Content
Hi David,
As per my understanding, from your query.
Create two variable :- vMax=Max(Year) & vPrev=$(vMax)-1
Put vMax into you first expression and vPrev in second expression with your needed measure, that would give you two lines in chart where you can see the difference in current & Previous year.
Regards,
Nitin G.