Unlock a world of possibilities! Login now and discover the exclusive benefits awaiting you.
- Qlik Community
- :
- Forums
- :
- Analytics
- :
- New to Qlik Analytics
- :
- Re: Conditional colors question
- Subscribe to RSS Feed
- Mark Topic as New
- Mark Topic as Read
- Float this Topic for Current User
- Bookmark
- Subscribe
- Mute
- Printer Friendly Page
- Mark as New
- Bookmark
- Subscribe
- Mute
- Subscribe to RSS Feed
- Permalink
- Report Inappropriate Content
Conditional colors question
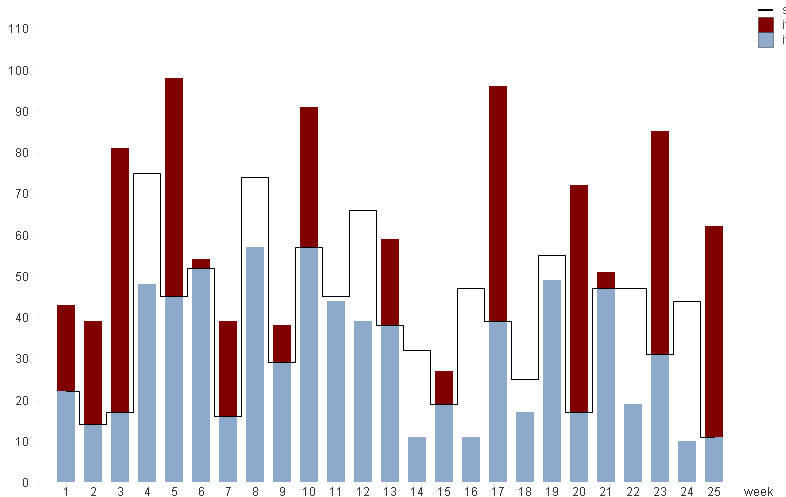
Question regarding conditional colors in a graph. Ive set the color of the bars to conditional. It should turn dark red when its value exceeds the other expresion, seen as the dotted line.
i.e.
if(expresion 1 > expresion 2), Red()
Now it turns the whole bar red instead of only the part above the line, is this possible to do in QV?
Accepted Solutions
- Mark as New
- Bookmark
- Subscribe
- Mute
- Subscribe to RSS Feed
- Permalink
- Report Inappropriate Content
- Mark as New
- Bookmark
- Subscribe
- Mute
- Subscribe to RSS Feed
- Permalink
- Report Inappropriate Content
Hi,
Since you can't cut a bar in two if an expression exceeds another, you would have to add a metric and make a stacked bar chart so that the first metric has a maximum value up until the dotted line and then the second metric would be the value higher than the dotted line.. Haven't tried this, but can't see how it would work otherwise...
BR
/Pierre
- Mark as New
- Bookmark
- Subscribe
- Mute
- Subscribe to RSS Feed
- Permalink
- Report Inappropriate Content
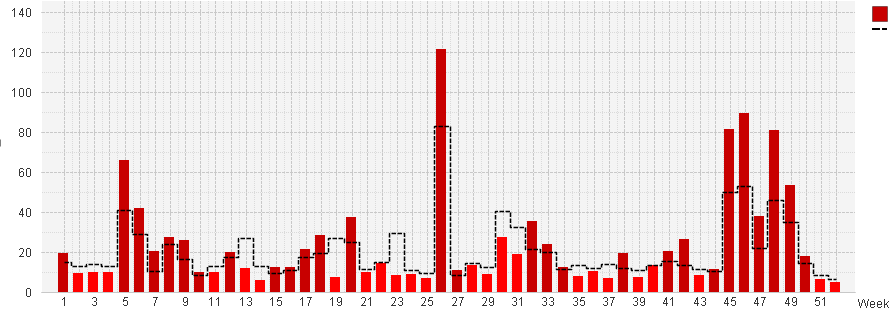
Hello, Using the Pierres idea , I made this. Please see attachment.