Unlock a world of possibilities! Login now and discover the exclusive benefits awaiting you.
- Qlik Community
- :
- Forums
- :
- Analytics
- :
- New to Qlik Analytics
- :
- Re: Counting Ranks. I have no idea :/
- Subscribe to RSS Feed
- Mark Topic as New
- Mark Topic as Read
- Float this Topic for Current User
- Bookmark
- Subscribe
- Mute
- Printer Friendly Page
- Mark as New
- Bookmark
- Subscribe
- Mute
- Subscribe to RSS Feed
- Permalink
- Report Inappropriate Content
Counting Ranks. I have no idea :/
I hope this is a simple task and that it is only me having problems because I am new to qlik.
Example:
I have 5 Products. And i have price information on that products for 3 online-shops
| Product | Shop A price | Shop B price | Shop C price |
|---|---|---|---|
| P1 | 1 | 2 | 3 |
| P2 | 2 | 1 | 3 |
| P3 | 3 | 1 | 2 |
| P4 | 2 | 1 | 2 |
| P5 | 1 | 2 | 3 |
I choose prices which are equivalent with the ranks which would result from rRnk(-shopprice, 1, 1).
In my fake-data (excel)
I have no seperate field for each shop. I simply have this format:
| product | shopname | shopprice |
|---|---|---|
| abc | someshop | 1337 |
What i want to get is a stacked bar-chart with shops as dimension.
The bars should stack the count of how often this shop has which rank (which price-position)
Thus shop A is 2 times cheapest, 2 times in the middle and 1 time the most expensive.
for now i have now idea how to count those different cases.
- Mark as New
- Bookmark
- Subscribe
- Mute
- Subscribe to RSS Feed
- Permalink
- Report Inappropriate Content
I think the structure you have right now is a better one from my point of view. You can add product as your 1st dimension and shopname as your second dimension and Sum(shopprice) or Avg(Shopprice) as your expression.
- Mark as New
- Bookmark
- Subscribe
- Mute
- Subscribe to RSS Feed
- Permalink
- Report Inappropriate Content
Can you please post more sample data & expected out put ?
- Mark as New
- Bookmark
- Subscribe
- Mute
- Subscribe to RSS Feed
- Permalink
- Report Inappropriate Content
This is part of my fake/test-data I use:
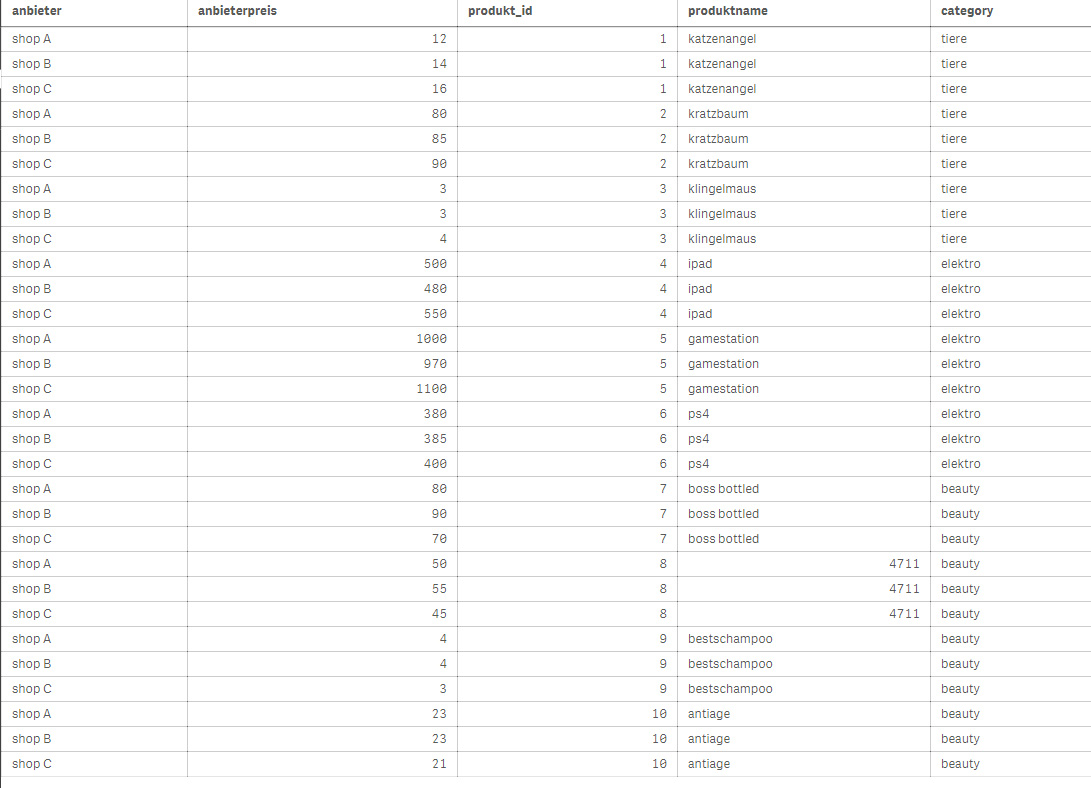
What I want to do is:
1. For each product be able to tell who is top1 to topN shop based on the price.
I managed that with the FirstSortedValue (but if there are two on top1 using the rank would be better)
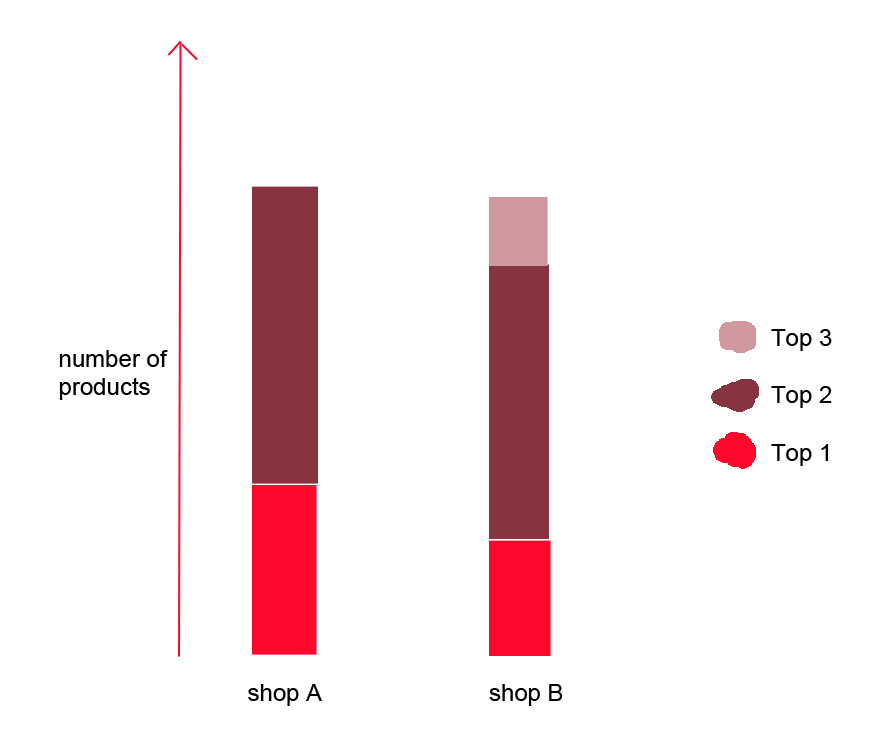
2. I want to see the distribution of price-positions per shop.
Thus with the given data shop A has:
Top1: 4 times
Top2: 6 times
Top 3: -
shop B:
Top1: 3 times
Top2: 5 times
Top 3: 1 time
As fake-Chart:
In a table it would be possible to show the AVG(position) per shop (if shop is the dimension in the table)
- Mark as New
- Bookmark
- Subscribe
- Mute
- Subscribe to RSS Feed
- Permalink
- Report Inappropriate Content
Use advanced editor to attach the data file to the post.
- Mark as New
- Bookmark
- Subscribe
- Mute
- Subscribe to RSS Feed
- Permalink
- Report Inappropriate Content
and where do i find this file on my disc?
or how can i export it?
- Mark as New
- Bookmark
- Subscribe
- Mute
- Subscribe to RSS Feed
- Permalink
- Report Inappropriate Content
you mean this file?