Unlock a world of possibilities! Login now and discover the exclusive benefits awaiting you.
- Qlik Community
- :
- Forums
- :
- Analytics
- :
- New to Qlik Analytics
- :
- Create a basic chart without a dimension
- Subscribe to RSS Feed
- Mark Topic as New
- Mark Topic as Read
- Float this Topic for Current User
- Bookmark
- Subscribe
- Mute
- Printer Friendly Page
- Mark as New
- Bookmark
- Subscribe
- Mute
- Subscribe to RSS Feed
- Permalink
- Report Inappropriate Content
Create a basic chart without a dimension
Not sure why I am struggling with this, but I have a basic CSV file with the (test) data as follows:
Hats,Shoes,Socks
2,34,543
2,34,55
I'm wanting to create a basic bar chart with totals, but when I do, it won't let me without specifying a dimension.
I've attached a sample file.
Thanks,
- Tags:
- barchart
- qlik sense
Accepted Solutions
- Mark as New
- Bookmark
- Subscribe
- Mute
- Subscribe to RSS Feed
- Permalink
- Report Inappropriate Content
I've made it work, by creating a dimension dummy in the master library with the function null().
Then you can drag this dimension into the barchart.
Kind Regards,
Dion
- Mark as New
- Bookmark
- Subscribe
- Mute
- Subscribe to RSS Feed
- Permalink
- Report Inappropriate Content
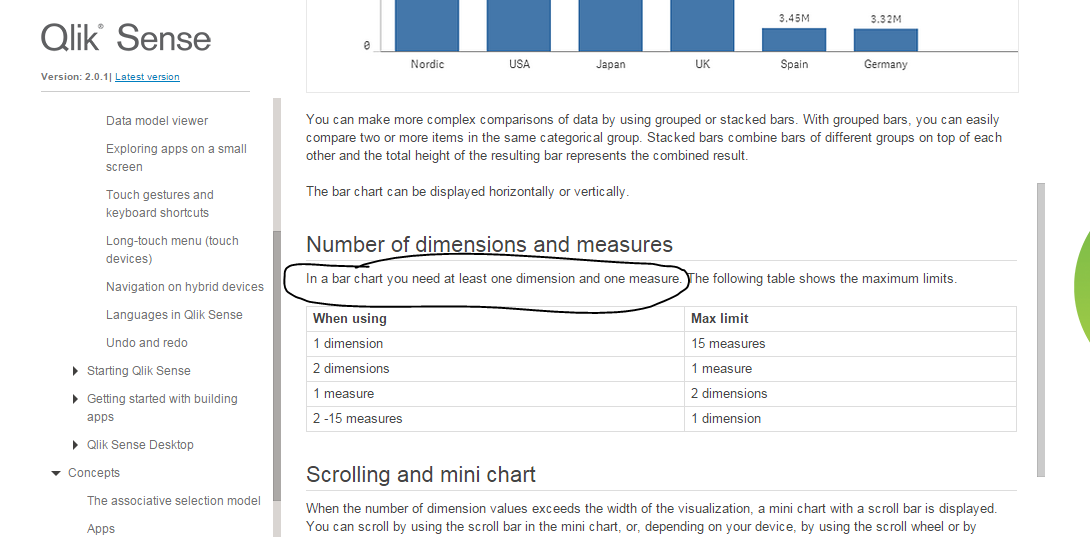
This is from Qlik Sense's help page:
HTH
Best,
Sunny
- Mark as New
- Bookmark
- Subscribe
- Mute
- Subscribe to RSS Feed
- Permalink
- Report Inappropriate Content
I've made it work, by creating a dimension dummy in the master library with the function null().
Then you can drag this dimension into the barchart.
Kind Regards,
Dion