Unlock a world of possibilities! Login now and discover the exclusive benefits awaiting you.
- Qlik Community
- :
- Forums
- :
- Analytics
- :
- New to Qlik Analytics
- :
- Re: Date range using YearQuarter
- Subscribe to RSS Feed
- Mark Topic as New
- Mark Topic as Read
- Float this Topic for Current User
- Bookmark
- Subscribe
- Mute
- Printer Friendly Page
- Mark as New
- Bookmark
- Subscribe
- Mute
- Subscribe to RSS Feed
- Permalink
- Report Inappropriate Content
Date range using YearQuarter
Hi,
I need to make a range using yearquarter like this:
2016-Q1 - 2016-Q2 if the users selects this way, other than that if they selects 2016-Q1 they will see the current selections and previous period 2015-Q1 numbers.
But when they selects the range as mentioned above like this 2016-Q1 - 2016-Q2 , the numbers of this will show the current range selections and the previous period range numbers for 2015-Q1 - 2015-Q2.
Data:
Customer, QuarterYear, Sales
AD, 20151, 200
AD, 20152, 300
AD, 20153, 150
AD, 20154, 130
AD, 20161, 460
AD, 20162, 340
AD, 20163, 560
BD, 20151, 250
BD, 20152, 370
BD, 20153, 160
BD, 20154, 135
BD, 20161, 466
BD, 20162, 390
BD, 20163, 570
CD, 20151, 210
CD, 20152, 323
CD, 20153, 145
CD, 20154, 136
CD, 20161, 467
CD, 20162, 343
CD, 20163, 568
Thanks,
BootCam
- « Previous Replies
-
- 1
- 2
- Next Replies »
Accepted Solutions
- Mark as New
- Bookmark
- Subscribe
- Mute
- Subscribe to RSS Feed
- Permalink
- Report Inappropriate Content
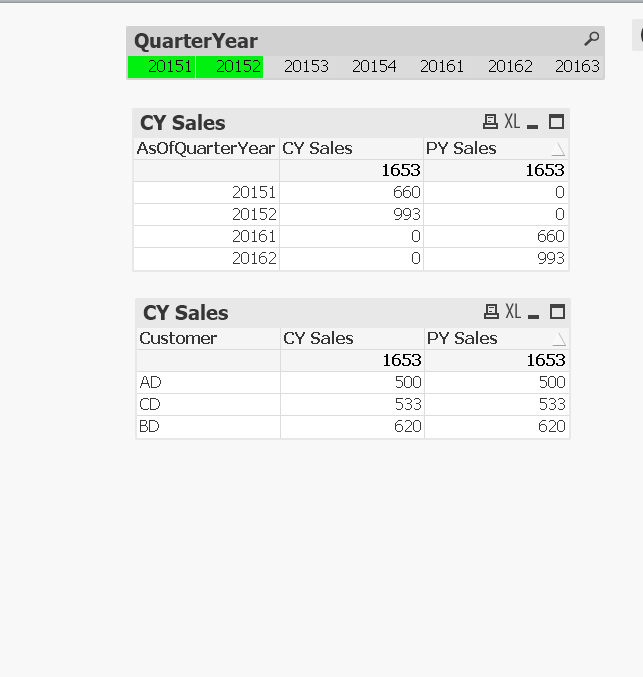
Make your selection in AsOfQuarterYear instead of QuarterYear unless you have a reason to select QuarterYear? If there is, change the expressions to this
Sum({<Flag={'CY'}, QuarterYear, AsOfQuarterYear = p(QuarterYear)>}Sales)
Sum({<Flag={'PY'}, QuarterYear, AsOfQuarterYear = p(QuarterYear)>}Sales)
- Mark as New
- Bookmark
- Subscribe
- Mute
- Subscribe to RSS Feed
- Permalink
- Report Inappropriate Content
And the requirement is that if the user select 2016-Q1 - 2016-Q2 , they see 2016-Q1 - 2016-Q2 and 2015-Q1 - 2015-Q2?
- Mark as New
- Bookmark
- Subscribe
- Mute
- Subscribe to RSS Feed
- Permalink
- Report Inappropriate Content
Thanks Sunny!
I am trying to do it in the front end.
Best,
BootCam
- Mark as New
- Bookmark
- Subscribe
- Mute
- Subscribe to RSS Feed
- Permalink
- Report Inappropriate Content
- Mark as New
- Bookmark
- Subscribe
- Mute
- Subscribe to RSS Feed
- Permalink
- Report Inappropriate Content
Hi Sunny,
Here it is:
1. I would like to have a QuarterYear list box where the user can select any YearQuarter and in the straight table they will see the value by this selection and also they will see the previous period value as well.
For example, If they select 2016-Q1 they will see the value of 2016-Q1 as the current period value and 2015-Q1 as the previous value.
2. If they select lets say multiple values like 2016-Q1 and 2016-Q2 at the same time they will see this as the current value but for the previous they will see the value for 2015-Q1 and 2015-Q2 value.
I know with this little data its kinda confusing but tried my best to explain.
Best,
BootCam
- Mark as New
- Bookmark
- Subscribe
- Mute
- Subscribe to RSS Feed
- Permalink
- Report Inappropriate Content
I think what you need is The As Of Table
Table:
LOAD *,
	 Date(MonthStart(Date#(Left(QuarterYear, 4) * 100 + Pick(Right(QuarterYear, 1), 3, 6, 9, 12), 'YYYYMM')), 'YYYYMM') as MonthYear;
LOAD * INLINE [
    Customer, QuarterYear, Sales
    AD, 20151, 200
    AD, 20152, 300
    AD, 20153, 150
    AD, 20154, 130
    AD, 20161, 460
    AD, 20162, 340
    AD, 20163, 560
    BD, 20151, 250
    BD, 20152, 370
    BD, 20153, 160
    BD, 20154, 135
    BD, 20161, 466
    BD, 20162, 390
    BD, 20163, 570
    CD, 20151, 210
    CD, 20152, 323
    CD, 20153, 145
    CD, 20154, 136
    CD, 20161, 467
    CD, 20162, 343
    CD, 20163, 568
];

AsOfTable:
LOAD MonthYear as AsOfMonthYear,
	 Year(MonthYear)*10 + Ceil(Month(MonthYear)/3) as AsOfQuarterYear,
	 MonthYear,
     'CY' as Flag
Resident Table;

Concatenate (AsOfTable)
LOAD MonthYear as AsOfMonthYear,
	 Year(MonthYear)*10 + Ceil(Month(MonthYear)/3) as AsOfQuarterYear,
	 AddYears(MonthYear, -1) as MonthYear,
     'PY' as Flag
Resident Table;
and then you can use this in your chart
Dimension
AsOfQuarterYear
Expressions
Current Year: Sum({<Flag = {'CY'}>}Sales)
Previous Year: Sum({<Flag = {'PY'}>}Sales)
- Mark as New
- Bookmark
- Subscribe
- Mute
- Subscribe to RSS Feed
- Permalink
- Report Inappropriate Content
Hi Sunny,
For some reason, i am getting the wrong numbers after selecting individual YearQuarter or Range of YearQuarter Selections. Could you suggest?
Best,
BootCam
- Mark as New
- Bookmark
- Subscribe
- Mute
- Subscribe to RSS Feed
- Permalink
- Report Inappropriate Content
- Mark as New
- Bookmark
- Subscribe
- Mute
- Subscribe to RSS Feed
- Permalink
- Report Inappropriate Content
Hi Sunny,
Please see the attachment for more elaboration.
Best,
BC
- Mark as New
- Bookmark
- Subscribe
- Mute
- Subscribe to RSS Feed
- Permalink
- Report Inappropriate Content
Make your selection in AsOfQuarterYear instead of QuarterYear unless you have a reason to select QuarterYear? If there is, change the expressions to this
Sum({<Flag={'CY'}, QuarterYear, AsOfQuarterYear = p(QuarterYear)>}Sales)
Sum({<Flag={'PY'}, QuarterYear, AsOfQuarterYear = p(QuarterYear)>}Sales)
- « Previous Replies
-
- 1
- 2
- Next Replies »