Unlock a world of possibilities! Login now and discover the exclusive benefits awaiting you.
- Qlik Community
- :
- Forums
- :
- Analytics
- :
- New to Qlik Analytics
- :
- Re: Disabling filtering of a dimension
- Subscribe to RSS Feed
- Mark Topic as New
- Mark Topic as Read
- Float this Topic for Current User
- Bookmark
- Subscribe
- Mute
- Printer Friendly Page
- Mark as New
- Bookmark
- Subscribe
- Mute
- Subscribe to RSS Feed
- Permalink
- Report Inappropriate Content
Disabling filtering of a dimension
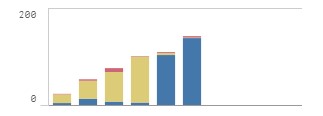
I have a stacked pie chart which displays states of orders per year. My dimension is
=YEAR([Data.OrderDate])
and my measures are
=Count({<[Data.State] = {'Open'}>} DISTINCT [Data.OrderNo]&'|'&[Data.State])
=Count({<[Data.State] = {'Closed'}>} DISTINCT [Data.OrderNo]&'|'&[Data.State])
=Count({<[Data.State] = {'Cancel'}>} DISTINCT [Data.OrderNo]&'|'&[Data.State])
My stacked vbar chart is one of many charts in the page. And I also have a filter pane which includes Order date as:
=YEAR([Data.OrderDate])
When I choose a specific year I want my stacked bar chart display all years regardless of Order date chosen, as it has never been filtered. How can I accomplish this?
Regards.
- « Previous Replies
-
- 1
- 2
- Next Replies »
Accepted Solutions
- Mark as New
- Bookmark
- Subscribe
- Mute
- Subscribe to RSS Feed
- Permalink
- Report Inappropriate Content
Try this
=Count({1<[Data.State] = {'Open'}>} DISTINCT [Data.OrderNo]&'|'&[Data.State])
=Count({1<[Data.State] = {'Closed'}>} DISTINCT [Data.OrderNo]&'|'&[Data.State])
=Count({1<[Data.State] = {'Cancel'}>} DISTINCT [Data.OrderNo]&'|'&[Data.State])
- Mark as New
- Bookmark
- Subscribe
- Mute
- Subscribe to RSS Feed
- Permalink
- Report Inappropriate Content
You can use the identifier {1} in the set analysis of your chart to ignore the user selections.
Ag+
- Mark as New
- Bookmark
- Subscribe
- Mute
- Subscribe to RSS Feed
- Permalink
- Report Inappropriate Content
If I would have been using an aggregate function such as SUM, COUNT or AVG I would have been placing {1} inside the function, but where should I place the {1} in this expression?
=YEAR([Data.OrderDate])
- Mark as New
- Bookmark
- Subscribe
- Mute
- Subscribe to RSS Feed
- Permalink
- Report Inappropriate Content
- Mark as New
- Bookmark
- Subscribe
- Mute
- Subscribe to RSS Feed
- Permalink
- Report Inappropriate Content
That is the problem. I need year filter for other charts and tables in the report but not this one. I am using year to create x-axis values in my chart.
My stacked-bar chart already displays Order for all available years and I do not want it to get filtered by year when I filter other charts and tables on the same page. I want to stay still whatever the year filter is set to.
- Mark as New
- Bookmark
- Subscribe
- Mute
- Subscribe to RSS Feed
- Permalink
- Report Inappropriate Content
=Count( {< [Data.State] = {'Open'}, [Data.OrderDate] = >} DISTINCT [Data.OrderNo] & '|' &[Data.State] )
I hope it helps.
- Mark as New
- Bookmark
- Subscribe
- Mute
- Subscribe to RSS Feed
- Permalink
- Report Inappropriate Content
Thank you very much for your help. But my page still filters when I select a year from the filter pane.
- Mark as New
- Bookmark
- Subscribe
- Mute
- Subscribe to RSS Feed
- Permalink
- Report Inappropriate Content
, [Data.OrderDate] =
in all your chart expressions ?
- Mark as New
- Bookmark
- Subscribe
- Mute
- Subscribe to RSS Feed
- Permalink
- Report Inappropriate Content
- Mark as New
- Bookmark
- Subscribe
- Mute
- Subscribe to RSS Feed
- Permalink
- Report Inappropriate Content
Try this
=Count({1<[Data.State] = {'Open'}>} DISTINCT [Data.OrderNo]&'|'&[Data.State])
=Count({1<[Data.State] = {'Closed'}>} DISTINCT [Data.OrderNo]&'|'&[Data.State])
=Count({1<[Data.State] = {'Cancel'}>} DISTINCT [Data.OrderNo]&'|'&[Data.State])
- « Previous Replies
-
- 1
- 2
- Next Replies »