Unlock a world of possibilities! Login now and discover the exclusive benefits awaiting you.
- Qlik Community
- :
- Forums
- :
- Analytics
- :
- New to Qlik Analytics
- :
- Re: Drill down by hierarchy Year then Month when d...
- Subscribe to RSS Feed
- Mark Topic as New
- Mark Topic as Read
- Float this Topic for Current User
- Bookmark
- Subscribe
- Mute
- Printer Friendly Page
- Mark as New
- Bookmark
- Subscribe
- Mute
- Subscribe to RSS Feed
- Permalink
- Report Inappropriate Content
Drill down by hierarchy Year then Month when data is in monthname() format?
Hi, my data set is structured by a master calendar with monthname() as the resulting value (Jan 2017, Feb 2017, etc). When using the filter pane I get a long list of months/years, but I would like to build a drill-down feature where the user can select the 1. year, and then the 2. month. Is this possible to do? Thank you for your help!
Accepted Solutions
- Mark as New
- Bookmark
- Subscribe
- Mute
- Subscribe to RSS Feed
- Permalink
- Report Inappropriate Content
See the attached file:
- Mark as New
- Bookmark
- Subscribe
- Mute
- Subscribe to RSS Feed
- Permalink
- Report Inappropriate Content
Yes, It's perfectmy possible.
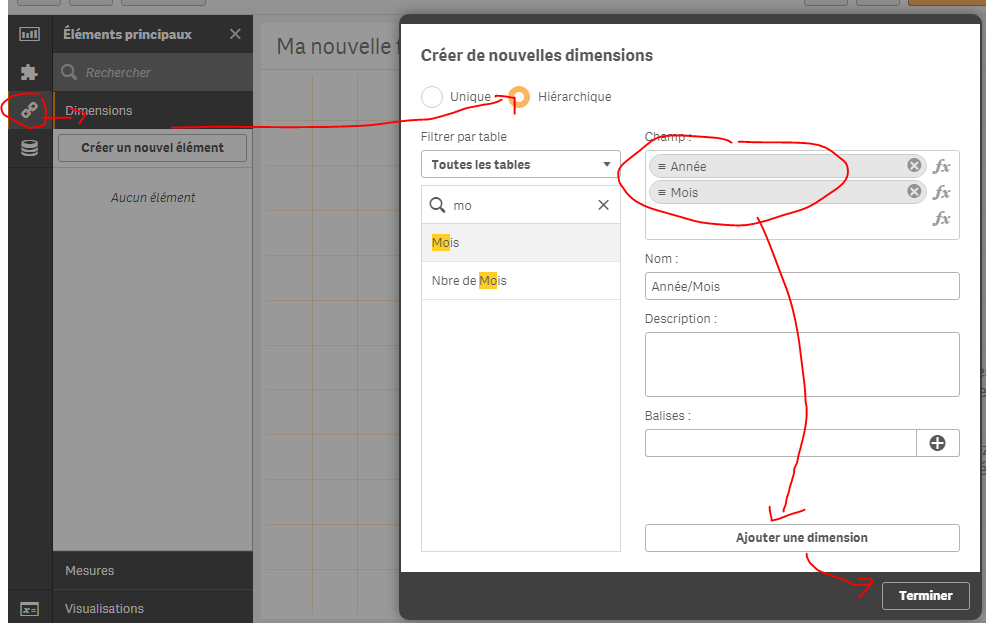
1) You create an hiearchical dimension as a master dimension composed of year and month:
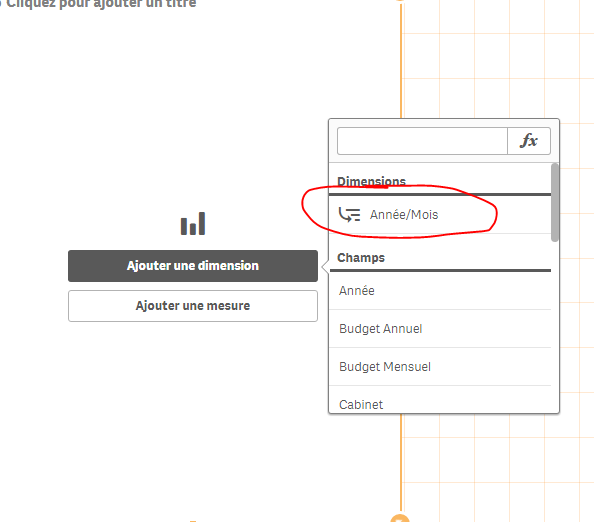
2) You use a bar chart for example, and as a dimension, you choose the newly created one (the hierarchical):
Result:
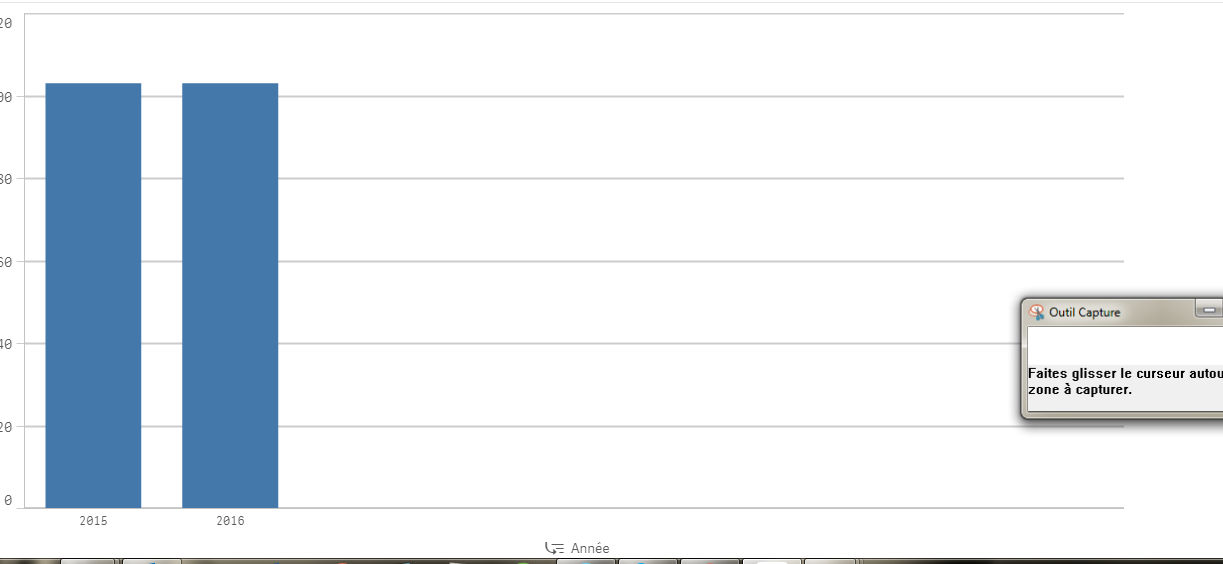
To go the months, select a year and confirm, its months will appears as dimensions:
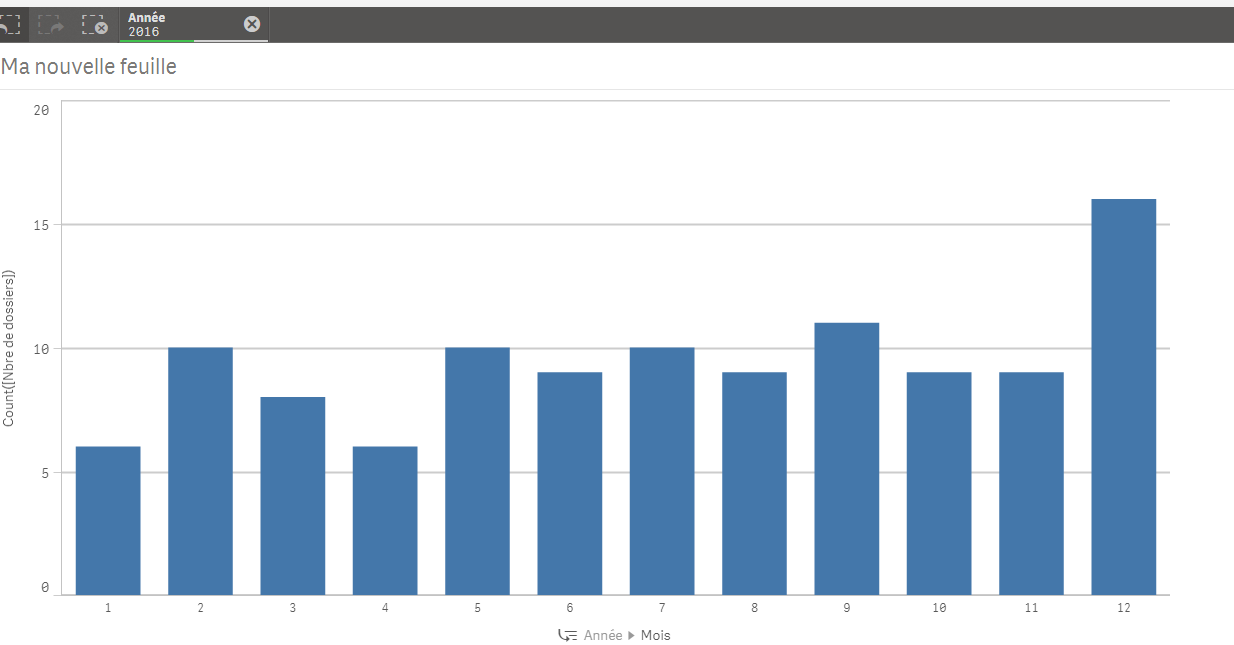
To go back to Year dimension, just click on the year (under the x-axis)
Hope this helps
- Mark as New
- Bookmark
- Subscribe
- Mute
- Subscribe to RSS Feed
- Permalink
- Report Inappropriate Content
thank you Omar. My data isnt broken up by two columns (month, and year) the two dimensions required for your suggestion. Right now it's just 1 column/ dimension with month-year for example (Jan 2017). What are your thoughts on what to do next?
- Mark as New
- Bookmark
- Subscribe
- Mute
- Subscribe to RSS Feed
- Permalink
- Report Inappropriate Content
Can you provide me with a sample qvf application to directly work on?
Thanks !
- Mark as New
- Bookmark
- Subscribe
- Mute
- Subscribe to RSS Feed
- Permalink
- Report Inappropriate Content
Hi Omar,
Attached is the qvf, the CalMonth dimension is the one I would be working with.
Thank you!
- Mark as New
- Bookmark
- Subscribe
- Mute
- Subscribe to RSS Feed
- Permalink
- Report Inappropriate Content
See the attached file:
- Mark as New
- Bookmark
- Subscribe
- Mute
- Subscribe to RSS Feed
- Permalink
- Report Inappropriate Content
Thank you, subfield() did the trick!
- Mark as New
- Bookmark
- Subscribe
- Mute
- Subscribe to RSS Feed
- Permalink
- Report Inappropriate Content
What I would do Monica, is creating those 2 new fields in the sript:
suppose your table is as follow:
Table:
load*,
subfield(CalMonth,' ',1) as Month,
subfield(CalMonth,' ',2) as Year;
load
A,
B,
Churn,
...
,
CalMonth ,
...
from source;
And the use these 2 new fields !
Have Nice days Monic !