Unlock a world of possibilities! Login now and discover the exclusive benefits awaiting you.
- Qlik Community
- :
- Forums
- :
- Analytics
- :
- New to Qlik Analytics
- :
- Dynamic Colors
- Subscribe to RSS Feed
- Mark Topic as New
- Mark Topic as Read
- Float this Topic for Current User
- Bookmark
- Subscribe
- Mute
- Printer Friendly Page
- Mark as New
- Bookmark
- Subscribe
- Mute
- Subscribe to RSS Feed
- Permalink
- Report Inappropriate Content
Dynamic Colors
Hello All
Please help me in the below query of Qlik Sense.
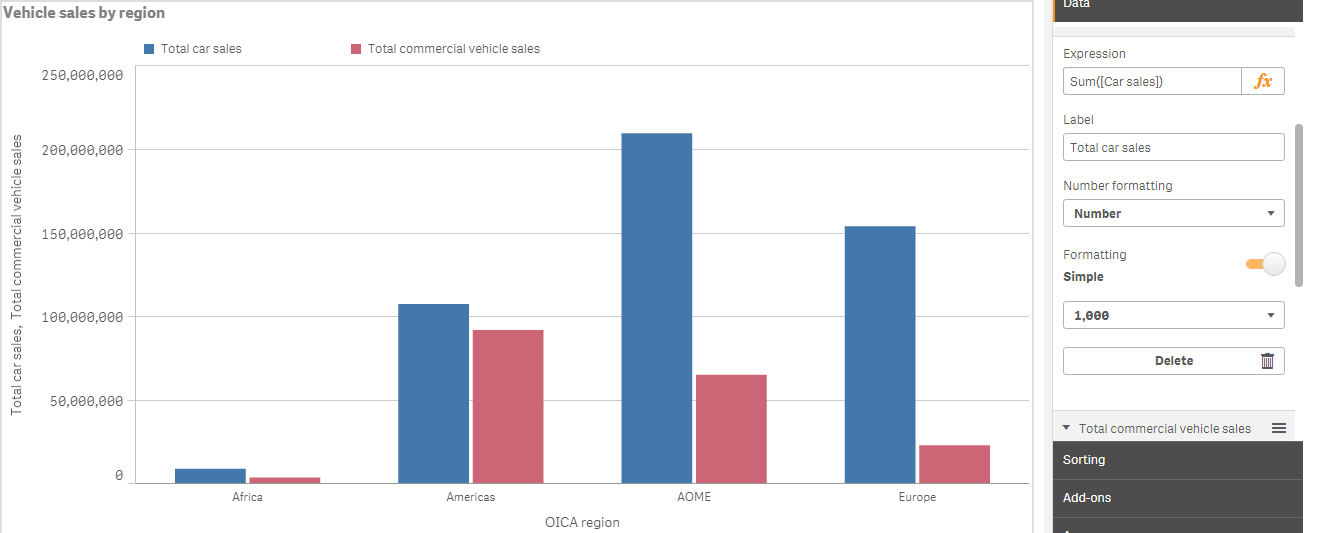
I want the dynamic color in my bar chart. I tried to use If condition in Color and Legend but it does not work well.
I want the first bar is of white green color and second bar is of light pink color.
Please guide me
Accepted Solutions
- Mark as New
- Bookmark
- Subscribe
- Mute
- Subscribe to RSS Feed
- Permalink
- Report Inappropriate Content
May be you can use 2 dimensions and one expressions and then use color by expression to get this
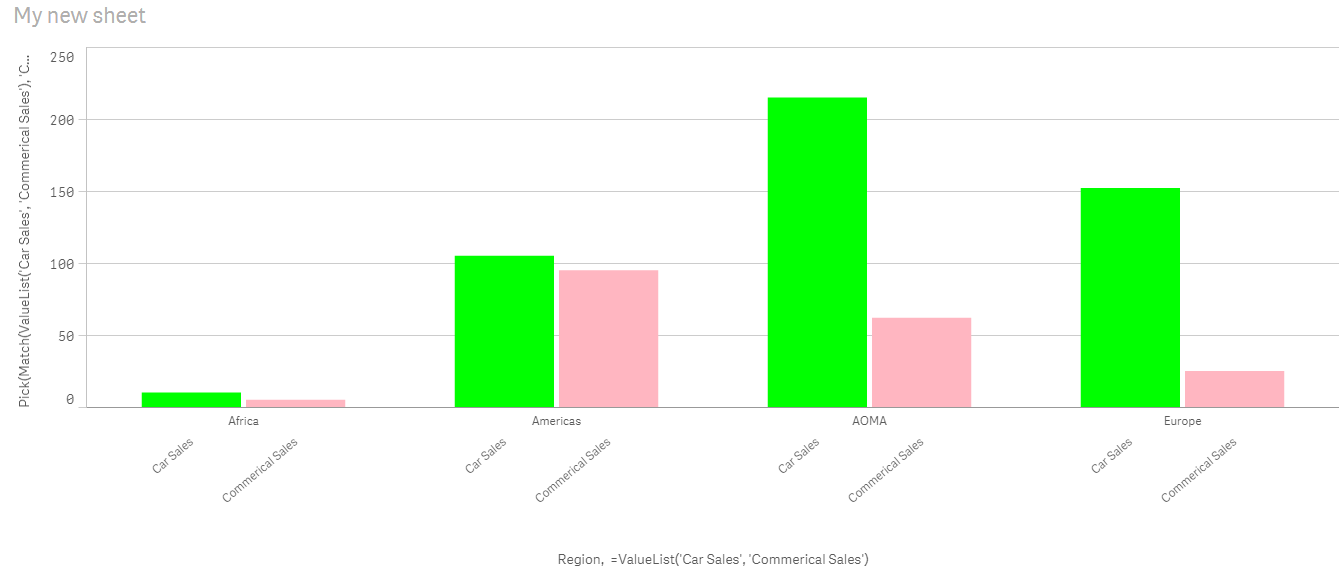
Dimensions
Region
=ValueList('Car Sales', 'Commerical Sales')
Expression
Pick(Match(ValueList('Car Sales', 'Commerical Sales'), 'Car Sales', 'Commerical Sales'),
Sum([Car Sales]), Sum([Commerical Sales]))
Expression for color
Pick(Match(ValueList('Car Sales', 'Commerical Sales'), 'Car Sales', 'Commerical Sales'),
LightGreen(), RGB(255,182,193))
- Mark as New
- Bookmark
- Subscribe
- Mute
- Subscribe to RSS Feed
- Permalink
- Report Inappropriate Content
May be you can use 2 dimensions and one expressions and then use color by expression to get this
Dimensions
Region
=ValueList('Car Sales', 'Commerical Sales')
Expression
Pick(Match(ValueList('Car Sales', 'Commerical Sales'), 'Car Sales', 'Commerical Sales'),
Sum([Car Sales]), Sum([Commerical Sales]))
Expression for color
Pick(Match(ValueList('Car Sales', 'Commerical Sales'), 'Car Sales', 'Commerical Sales'),
LightGreen(), RGB(255,182,193))
- Mark as New
- Bookmark
- Subscribe
- Mute
- Subscribe to RSS Feed
- Permalink
- Report Inappropriate Content
Thanks a lot Sunny for help!!
Please explain Expression and Expression in Colour part.
Thanks
- Mark as New
- Bookmark
- Subscribe
- Mute
- Subscribe to RSS Feed
- Permalink
- Report Inappropriate Content
Hi Deepanshu -
I am not sure which part of the expression and expression in color part isn't clear? Have you used ValueList() function before? When you use valuelist, that's how your expression needs to look like. I can share a blog where you might see how ValueList is usually used:
ValueList() – For those tricky situations
In the above blog, the expression used if statement
=If(ValueList('My First KPI','My Second KPI')='My First KPI',
Sum([My First KPI Field],
Count([My Second KPI Field]))
But I prefer to use Pick(Match)) where ever possible. So, my version of the above expression would be
Pick(Match(ValueList('My First KPI', 'My Second KPI'), 'My First KPI', 'My Second KPI'),
Sum([My First KPI Field],
Count([My Second KPI Field])
Here is another useful blog that might help you learn about ValueList and ValueLoop
- Mark as New
- Bookmark
- Subscribe
- Mute
- Subscribe to RSS Feed
- Permalink
- Report Inappropriate Content
Sunny, how this possible if there is date dimension on Bar chart and for maximum four dates we have to assign four different colours on bar chart and having single expression.
Any responses ???
- Mark as New
- Bookmark
- Subscribe
- Mute
- Subscribe to RSS Feed
- Permalink
- Report Inappropriate Content
Hey Anand, it might help to see an example to help you better my friend?
- Mark as New
- Bookmark
- Subscribe
- Mute
- Subscribe to RSS Feed
- Permalink
- Report Inappropriate Content
if you are using latest version then you can assign Custom colors to Master Dimension Values
- Mark as New
- Bookmark
- Subscribe
- Mute
- Subscribe to RSS Feed
- Permalink
- Report Inappropriate Content
Hi Sunny, Assume this sample and let me know.