Unlock a world of possibilities! Login now and discover the exclusive benefits awaiting you.
- Qlik Community
- :
- Forums
- :
- Analytics
- :
- New to Qlik Analytics
- :
- Extension textbox Qlik Sense
- Subscribe to RSS Feed
- Mark Topic as New
- Mark Topic as Read
- Float this Topic for Current User
- Bookmark
- Subscribe
- Mute
- Printer Friendly Page
- Mark as New
- Bookmark
- Subscribe
- Mute
- Subscribe to RSS Feed
- Permalink
- Report Inappropriate Content
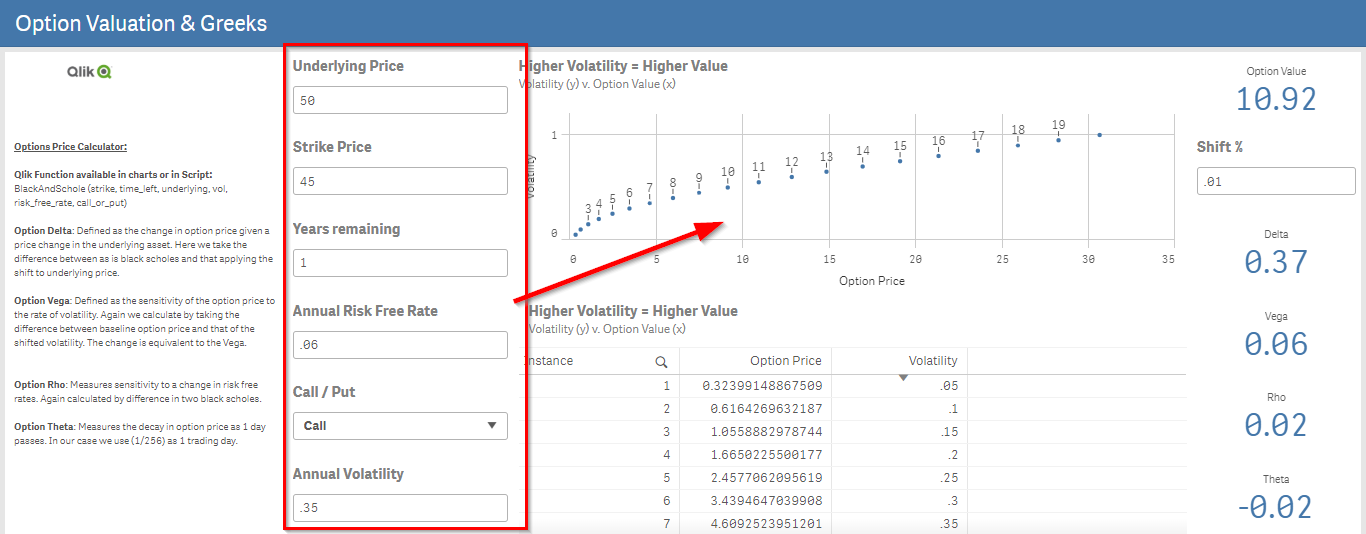
Extension textbox Qlik Sense
Hello everyone, Someone can tell me how this textbox extension is called, that when entering data, it calculates the result of the graph.
Accepted Solutions
- Mark as New
- Bookmark
- Subscribe
- Mute
- Subscribe to RSS Feed
- Permalink
- Report Inappropriate Content
It looks like the qsVariable extension of Erik Wetterberg which can be found here:
https://github.com/erikwett/qsVariable
The distribution file is here:
https://github.com/erikwett/qsVariable/raw/master/dist/variable.zip
- Mark as New
- Bookmark
- Subscribe
- Mute
- Subscribe to RSS Feed
- Permalink
- Report Inappropriate Content
My guess would be that entering the value in the box is being stored in a defined variable which is then used by the charts in the dashboard.
- Mark as New
- Bookmark
- Subscribe
- Mute
- Subscribe to RSS Feed
- Permalink
- Report Inappropriate Content
How could I do that ? 
- Mark as New
- Bookmark
- Subscribe
- Mute
- Subscribe to RSS Feed
- Permalink
- Report Inappropriate Content
It looks like the qsVariable extension of Erik Wetterberg which can be found here:
https://github.com/erikwett/qsVariable
The distribution file is here:
https://github.com/erikwett/qsVariable/raw/master/dist/variable.zip
- Mark as New
- Bookmark
- Subscribe
- Mute
- Subscribe to RSS Feed
- Permalink
- Report Inappropriate Content
Thanks Petter.
- Mark as New
- Bookmark
- Subscribe
- Mute
- Subscribe to RSS Feed
- Permalink
- Report Inappropriate Content
you're welcome 