Unlock a world of possibilities! Login now and discover the exclusive benefits awaiting you.
- Qlik Community
- :
- Forums
- :
- Analytics
- :
- New to Qlik Analytics
- :
- Re: Get the date of min and max value
- Subscribe to RSS Feed
- Mark Topic as New
- Mark Topic as Read
- Float this Topic for Current User
- Bookmark
- Subscribe
- Mute
- Printer Friendly Page
- Mark as New
- Bookmark
- Subscribe
- Mute
- Subscribe to RSS Feed
- Permalink
- Report Inappropriate Content
Get the date of min and max value
Hi everyone,
Another question for you.
In my pivot table I'd like to display the date of my min and max values.
I tried the following:
(Min)=FirstSortedValue([Date],[Resultat])
(Max)=FirstSortedValue([Date],-[Resultat])
But I'm not getting exactly what I want... here's an example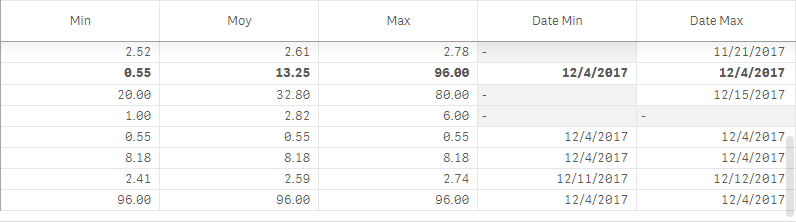
So as you can see and I have a min and max value for each row. But some dates are unexpectedly missing and I don't understand why.
Would someone have a hint?
Thanks,
- Tags:
- max min
Accepted Solutions
- Mark as New
- Bookmark
- Subscribe
- Mute
- Subscribe to RSS Feed
- Permalink
- Report Inappropriate Content
You can try:
(Min)=FirstSortedValue(DISTINCT [Date],[Resultat])
to see if it gives the right result. Or explicitly add a bias to get the min date when there is a tie.
(Min)=FirstSortedValue([Date],[Resultat] + (Date * 0.0001))
-Rob
- Mark as New
- Bookmark
- Subscribe
- Mute
- Subscribe to RSS Feed
- Permalink
- Report Inappropriate Content
Hi
you may have tie values,
in that case firstsortedvalues return null
regards
- Mark as New
- Bookmark
- Subscribe
- Mute
- Subscribe to RSS Feed
- Permalink
- Report Inappropriate Content
maybe this:
=FirstSortedValue( Date, Aggr( Sum(Resultat), Date ) )
I hope it helps.
- Mark as New
- Bookmark
- Subscribe
- Mute
- Subscribe to RSS Feed
- Permalink
- Report Inappropriate Content
You are right.
I have multiple times the same min and the same max.
So what if I want the minimum date among my minimum values?
Thanks!
- Mark as New
- Bookmark
- Subscribe
- Mute
- Subscribe to RSS Feed
- Permalink
- Report Inappropriate Content
You can try:
(Min)=FirstSortedValue(DISTINCT [Date],[Resultat])
to see if it gives the right result. Or explicitly add a bias to get the min date when there is a tie.
(Min)=FirstSortedValue([Date],[Resultat] + (Date * 0.0001))
-Rob
- Mark as New
- Bookmark
- Subscribe
- Mute
- Subscribe to RSS Feed
- Permalink
- Report Inappropriate Content
That worked:
=FirstSortedValue([Date],[Resultat] + (Date * 0.0001))
Thank you!