Unlock a world of possibilities! Login now and discover the exclusive benefits awaiting you.
- Qlik Community
- :
- Forums
- :
- Analytics
- :
- New to Qlik Analytics
- :
- How do I manually select data to construct my visu...
- Subscribe to RSS Feed
- Mark Topic as New
- Mark Topic as Read
- Float this Topic for Current User
- Bookmark
- Subscribe
- Mute
- Printer Friendly Page
- Mark as New
- Bookmark
- Subscribe
- Mute
- Subscribe to RSS Feed
- Permalink
- Report Inappropriate Content
How do I manually select data to construct my visualisations?
So I've just dabbled into Qlikview Sense and I want to incoporate some football match analysis into a visual form.
Since the amount of data I have is not excessive, it would make sense to include them all in one sheet.

I want to separate each group into their own fields. E.g. Shots, Possession, Possession in thirds, Short passing, etc.
Also, I've tried making a new sheet in Excel for every variable, but Qlikview Sense groups up my Match variables (match 1, 2, etc.).
Is there a way around this? Thanks!
- Mark as New
- Bookmark
- Subscribe
- Mute
- Subscribe to RSS Feed
- Permalink
- Report Inappropriate Content
Hello,
In this case, you should save each group into a separate CSV or XLS file.
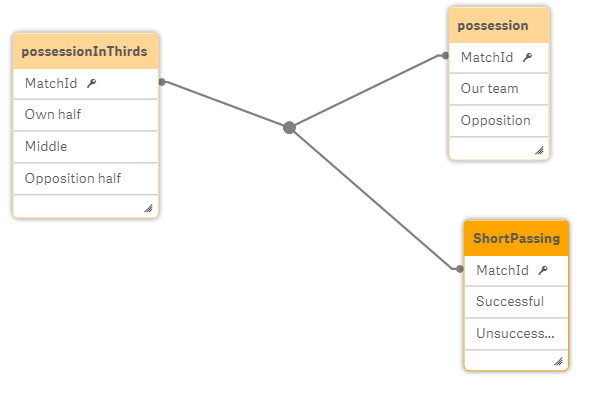
Qliksense links the tables by a common key, so you have to change your data schema in order to make it happen.
I suggest you to create a key called MatchId as the following example, and to use the same idea for each group:

By doing so you will have a data model such as:

And will be able to create tables, pivot tables, etc.
I also recommend this tutorial Qlik Sense Desktop - Comprehensive Quick Build Tutorial to get started.
I hope it helps,
Estela