Unlock a world of possibilities! Login now and discover the exclusive benefits awaiting you.
Announcements
SYSTEM MAINTENANCE: Thurs., Sept. 19, 1 AM ET, Platform will be unavailable for approx. 60 minutes.
- Qlik Community
- :
- Forums
- :
- Analytics
- :
- New to Qlik Analytics
- :
- How to create theTable with embedded charts?Circul...
Options
- Subscribe to RSS Feed
- Mark Topic as New
- Mark Topic as Read
- Float this Topic for Current User
- Bookmark
- Subscribe
- Mute
- Printer Friendly Page
Turn on suggestions
Auto-suggest helps you quickly narrow down your search results by suggesting possible matches as you type.
Showing results for
Anonymous
Not applicable
2017-11-01
04:54 AM
- Mark as New
- Bookmark
- Subscribe
- Mute
- Subscribe to RSS Feed
- Permalink
- Report Inappropriate Content
How to create theTable with embedded charts?Circular chart?
Hi,
was watching qlik Education video
http://help.qlik.com/en-US/sense/September2017/Content/Videos/Videos-choose-chart-comparison.htm
1. really interested in how to create the Table with embedded charts?
where could i find more info regarding how to creat that?
also 2. here is another example showing a graph like this (I want to do 6 Categoris instead of 6 Regions ) any one could give me some hands on tips how to make it?
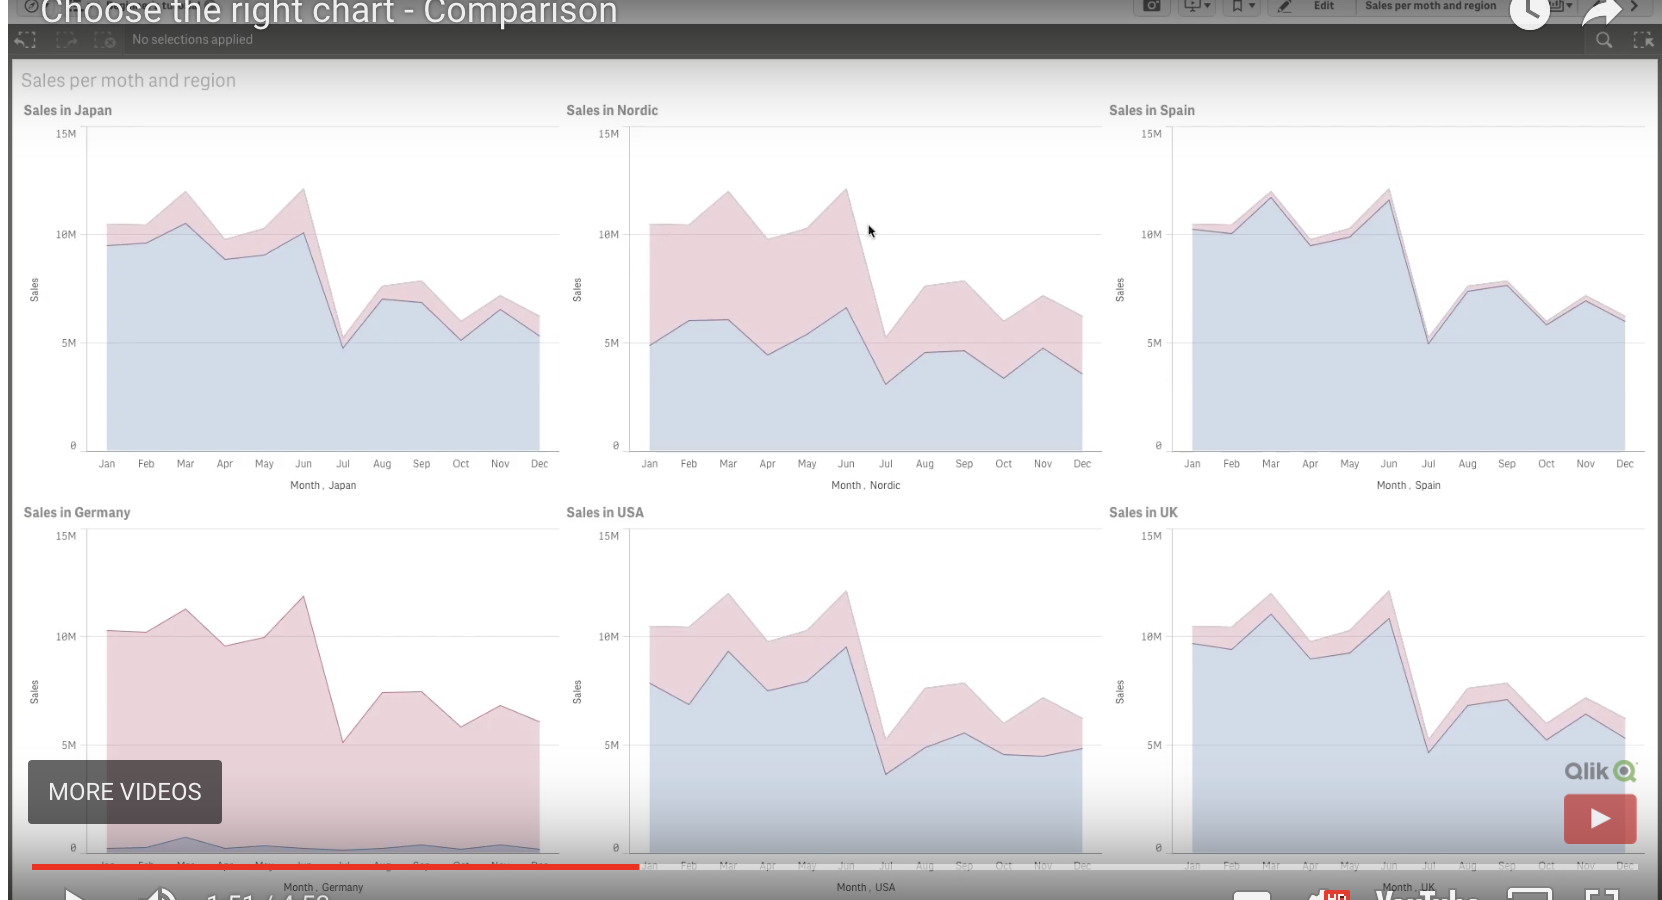
I did not know also, how can I only chose 1 region data in single one graph?
3. it also mentioned 'Circular chart', i cannot find the available chart time in my Qlik sense cloud menu. Anyone can help?
Thank you!
631 Views
0 Replies
Community Browser