Unlock a world of possibilities! Login now and discover the exclusive benefits awaiting you.
- Qlik Community
- :
- Forums
- :
- Analytics
- :
- New to Qlik Analytics
- :
- Re: How to eliminate zero in the Graph
- Subscribe to RSS Feed
- Mark Topic as New
- Mark Topic as Read
- Float this Topic for Current User
- Bookmark
- Subscribe
- Mute
- Printer Friendly Page
- Mark as New
- Bookmark
- Subscribe
- Mute
- Subscribe to RSS Feed
- Permalink
- Report Inappropriate Content
How to eliminate zero in the Graph
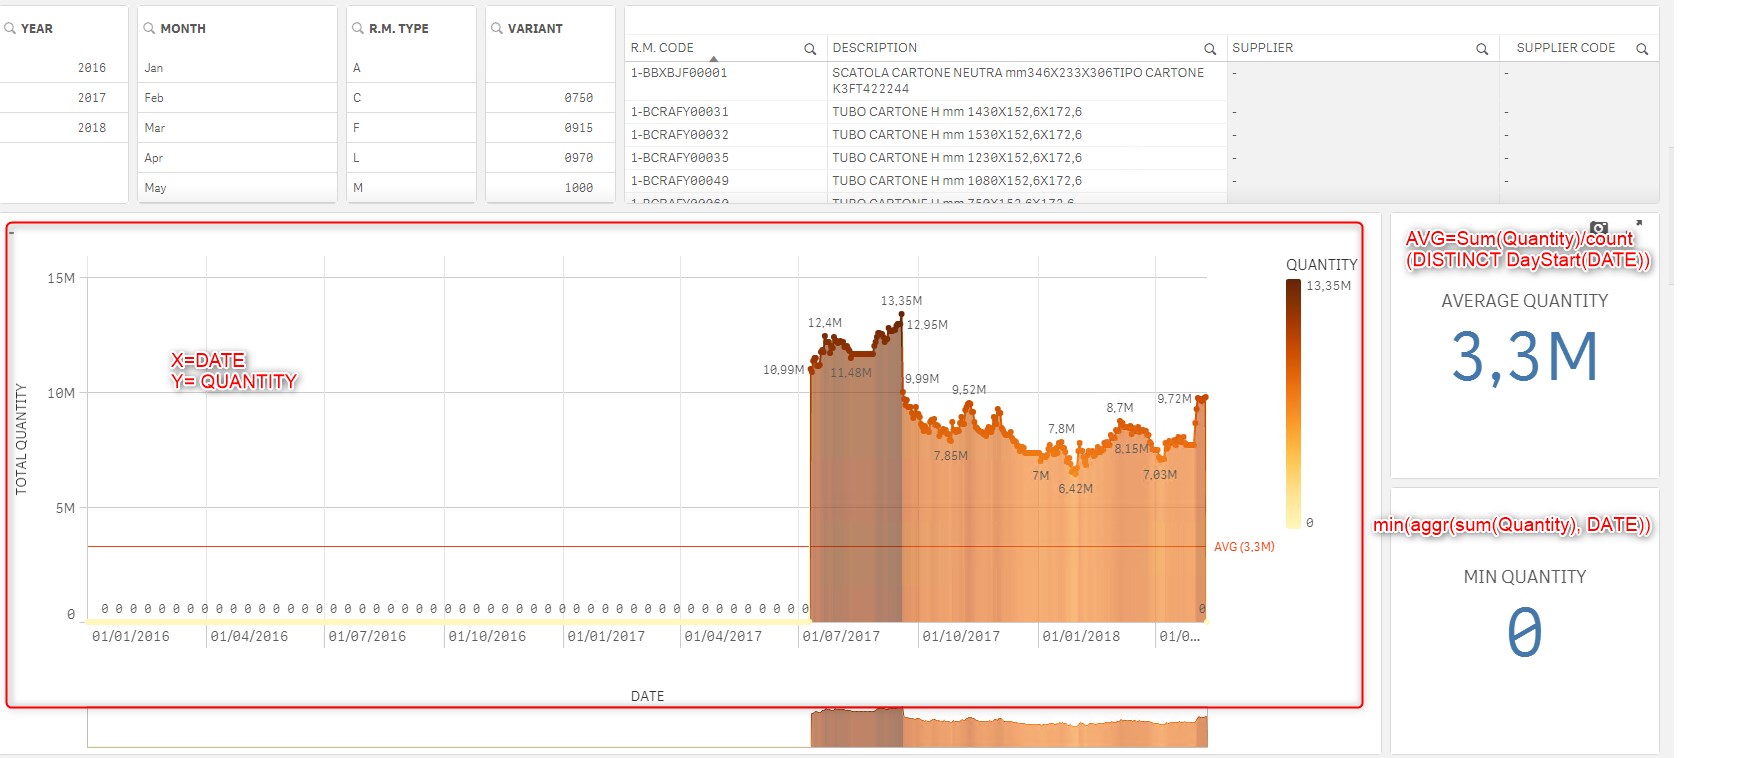
Hollo Everybody, I am using QlikSense Desktop version and i am facing a problem while developing an APP.. I would like to omit zero part of the graph to have a better view and to see the min values and the avg values correctly, i do not want to insert a condition in the SQL part, and i did check the option "remove zero or remove null value " on the properties part, it worked for the graph only , not for the MIn and AVG,
is there any way to remove the zeros and see the effect in the graph as well as in the labels MIN and AVG ?
P:S.. you can see the scripting or the fileds assigned for each part on the picture in red colour
- « Previous Replies
-
- 1
- 2
- Next Replies »
- Mark as New
- Bookmark
- Subscribe
- Mute
- Subscribe to RSS Feed
- Permalink
- Report Inappropriate Content
Hi,
uncheck "show nulls" option and check "suppress zero values" option
- Mark as New
- Bookmark
- Subscribe
- Mute
- Subscribe to RSS Feed
- Permalink
- Report Inappropriate Content
Under adds-on, uncheck show Zero values
- Mark as New
- Bookmark
- Subscribe
- Mute
- Subscribe to RSS Feed
- Permalink
- Report Inappropriate Content
Thank you for your answer,
In which part or graph i shoud unchek null and then check surpress?
would you please provide me a screenshot of how to do that ?
by the way the is no option for null option in line chart, i had to add bar chart first and uncheck the null and then convert the chart to line chart .
- Mark as New
- Bookmark
- Subscribe
- Mute
- Subscribe to RSS Feed
- Permalink
- Report Inappropriate Content
I did that , it only workes for the chart not for the Min and Avg computations
- Mark as New
- Bookmark
- Subscribe
- Mute
- Subscribe to RSS Feed
- Permalink
- Report Inappropriate Content
My sense Cloud are in French so just search these options on the right panel (the properties of the chart).
- Mark as New
- Bookmark
- Subscribe
- Mute
- Subscribe to RSS Feed
- Permalink
- Report Inappropriate Content
if you're talking about the avg and the min objects on the right of the screen shot, you will need to add an aggregation to aggregate that min and that avg on a specific dimension.
- Mark as New
- Bookmark
- Subscribe
- Mute
- Subscribe to RSS Feed
- Permalink
- Report Inappropriate Content
I see:
try something like: (alter it to ur need)
sum({<YourDim={"=sum({1}YourMeasure)>0"}>}YourMeasure)
- Mark as New
- Bookmark
- Subscribe
- Mute
- Subscribe to RSS Feed
- Permalink
- Report Inappropriate Content
dude , would you provide me an example for Min and avg , how to aggregate starting from a specific date ?
i have read every post in the community, no luck!
- Mark as New
- Bookmark
- Subscribe
- Mute
- Subscribe to RSS Feed
- Permalink
- Report Inappropriate Content
i want to omit the zero values from the begining ! if i uncheck the null , every null value will be removed ! while i do not want that because i want to consider the weekends , i only want to omit the begining
- « Previous Replies
-
- 1
- 2
- Next Replies »