Unlock a world of possibilities! Login now and discover the exclusive benefits awaiting you.
- Qlik Community
- :
- Forums
- :
- Analytics
- :
- New to Qlik Analytics
- :
- Re: How to make some filters affect a chart and ot...
- Subscribe to RSS Feed
- Mark Topic as New
- Mark Topic as Read
- Float this Topic for Current User
- Bookmark
- Subscribe
- Mute
- Printer Friendly Page
- Mark as New
- Bookmark
- Subscribe
- Mute
- Subscribe to RSS Feed
- Permalink
- Report Inappropriate Content
How to make some filters affect a chart and other filters not affect it?
Hi,
I have a sales by year trend line chart in QLik sense. I also have year,age,gender,segments etc. as filters.
Now, I would not want my trend line to be affected by the year filter but by all the other filters.
How should I write the sales set expression for the same.
Any help would be appreciated.
Thanks,
Sowmya
Accepted Solutions
- Mark as New
- Bookmark
- Subscribe
- Mute
- Subscribe to RSS Feed
- Permalink
- Report Inappropriate Content
As Sunny mentioned, a set analysis expression will solve your issue
You can also use this:
sum(<{ Year = }>Sales)
- Mark as New
- Bookmark
- Subscribe
- Mute
- Subscribe to RSS Feed
- Permalink
- Report Inappropriate Content
Add it like this to your expression:
{1<Year = $::Year>}
Alternatively, you can also try this:
{<Age, Gender, Segments, ...>}
- Mark as New
- Bookmark
- Subscribe
- Mute
- Subscribe to RSS Feed
- Permalink
- Report Inappropriate Content
As Sunny mentioned, a set analysis expression will solve your issue
You can also use this:
sum(<{ Year = }>Sales)
- Mark as New
- Bookmark
- Subscribe
- Mute
- Subscribe to RSS Feed
- Permalink
- Report Inappropriate Content
sangram, I might be wrong, but it seems the OP wants the chart to change based on year and not others.
- Mark as New
- Bookmark
- Subscribe
- Mute
- Subscribe to RSS Feed
- Permalink
- Report Inappropriate Content
Hi Sunny,
Thats fine! But the query above says , the person does not want the Year filter to work.
- Mark as New
- Bookmark
- Subscribe
- Mute
- Subscribe to RSS Feed
- Permalink
- Report Inappropriate Content
You are right, I missed 'not'  . My bad
- Mark as New
- Bookmark
- Subscribe
- Mute
- Subscribe to RSS Feed
- Permalink
- Report Inappropriate Content
Hi ,
Thanks Sangram and Sunny!
I think you meant sum( {< Year = >} Sales) and not sum(<{ Year = }>Sales).
And it definitely works for every other field i add apart from year. for e.g: sum( {< Age = >} Sales) or something similar is working by restricting filter on Age.
What I would like to clarify is my year field comes from a date field by using the Qlik auto generated year field.(screenshot below).
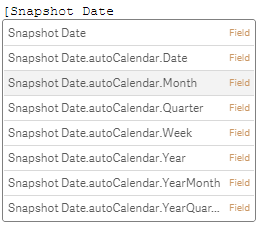
When I add the date field directly to filter pane and use sum( {< Snapshot Date = >} Sales) it works!!
But sum( {< [Snapshot Date.autoCalendar.Year] = >} Sales) does not.
Any suggestions?
- Mark as New
- Bookmark
- Subscribe
- Mute
- Subscribe to RSS Feed
- Permalink
- Report Inappropriate Content
Update to above:
I tried deriving the year field from date field in script and used the new field instead of the auto generated field and it works.
My understanding is that this that happens with auto calendar generated date fields!! not sure why though.
Thank you once again!
- Mark as New
- Bookmark
- Subscribe
- Mute
- Subscribe to RSS Feed
- Permalink
- Report Inappropriate Content
HI Sowmya,
Is it possible to share the app?