Unlock a world of possibilities! Login now and discover the exclusive benefits awaiting you.
- Qlik Community
- :
- Forums
- :
- Analytics
- :
- New to Qlik Analytics
- :
- Re: How to plot chart show sales and debt in one c...
- Subscribe to RSS Feed
- Mark Topic as New
- Mark Topic as Read
- Float this Topic for Current User
- Bookmark
- Subscribe
- Mute
- Printer Friendly Page
- Mark as New
- Bookmark
- Subscribe
- Mute
- Subscribe to RSS Feed
- Permalink
- Report Inappropriate Content
How to plot chart show sales and debt in one chart ?
Hi All
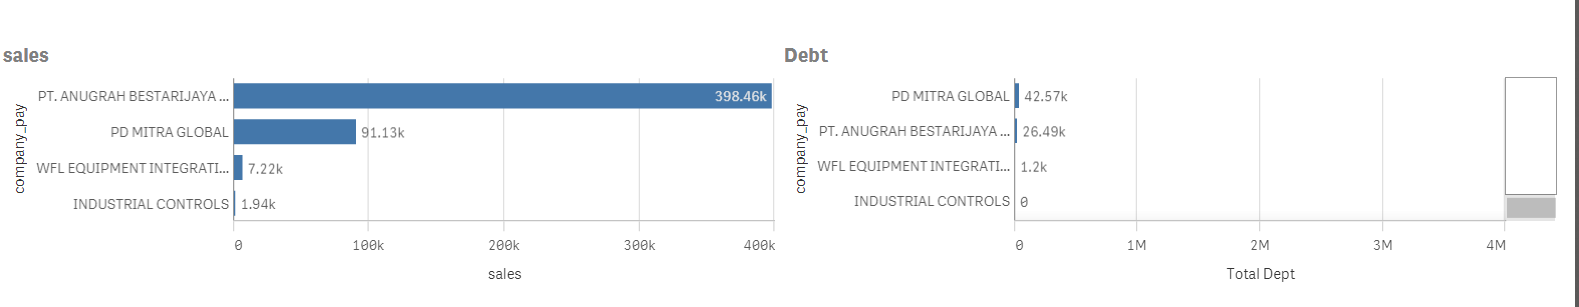
I have below 2 bar chart , i like to combine both bar chart into 1 bar chart , so that i can view their sales vs debt amount in one chart. it is possible in QS ?
Accepted Solutions
- Mark as New
- Bookmark
- Subscribe
- Mute
- Subscribe to RSS Feed
- Permalink
- Report Inappropriate Content
Hi Paul,
I think you don't need to use two different axes for two expressions because both the expressions is having the near values, also it would be confusing to users if you use two axes. You have to go for two axes if you are comparing Percentages and Numbers or Sum(Sales) and Count(Salesman) like this.
Hope this helps you.
Regards,
Jagan.
- Mark as New
- Bookmark
- Subscribe
- Mute
- Subscribe to RSS Feed
- Permalink
- Report Inappropriate Content
Enclosed my QS doc.
- Mark as New
- Bookmark
- Subscribe
- Mute
- Subscribe to RSS Feed
- Permalink
- Report Inappropriate Content
Hi,
You can have both charts in the same chart
step1->goto->new sheet object->chart object->click on bar chart as shown in figure1->enter the 2 expression in the expression tab as shown in figure2->then go to axes tab for sales click on position as shown in figure 3 and for Depth click on position as shown in figure 4.
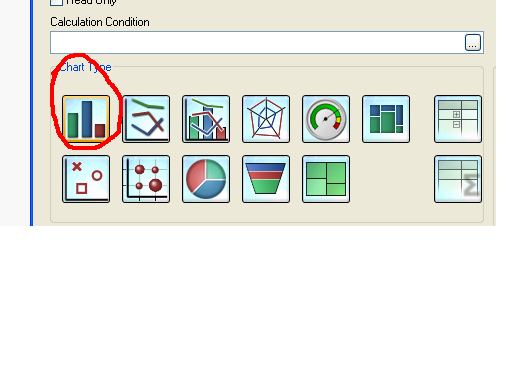 figure1
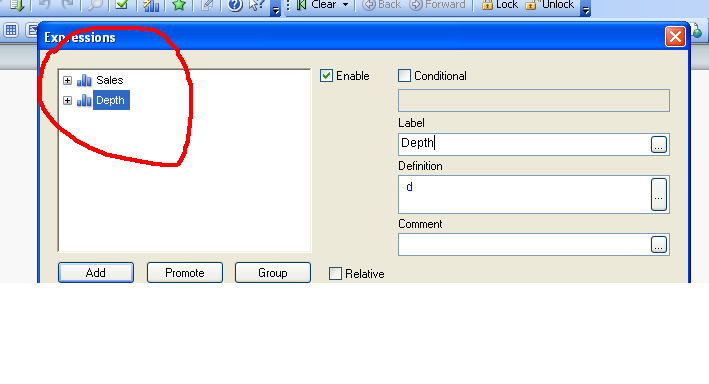 figure2
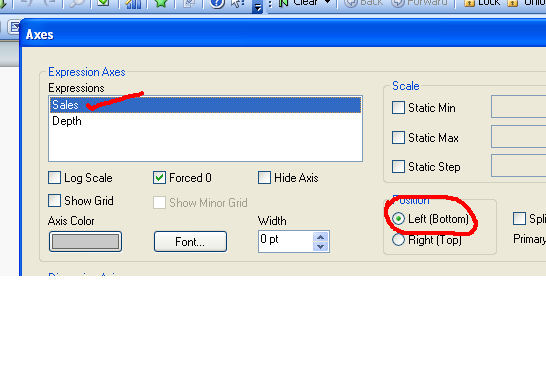 figure 3
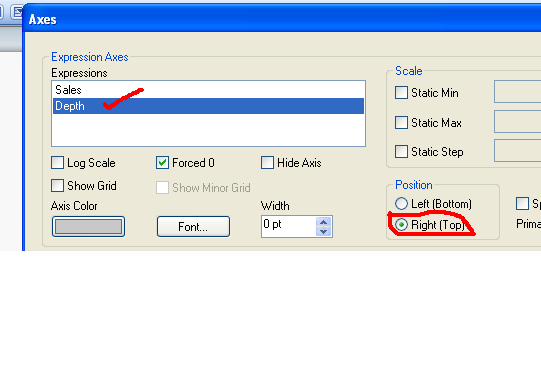 figure 4
- Mark as New
- Bookmark
- Subscribe
- Mute
- Subscribe to RSS Feed
- Permalink
- Report Inappropriate Content
Hi Paul,
I think you don't need to use two different axes for two expressions because both the expressions is having the near values, also it would be confusing to users if you use two axes. You have to go for two axes if you are comparing Percentages and Numbers or Sum(Sales) and Count(Salesman) like this.
Hope this helps you.
Regards,
Jagan.
- Mark as New
- Bookmark
- Subscribe
- Mute
- Subscribe to RSS Feed
- Permalink
- Report Inappropriate Content
Hi Jagon
Thank you for your reply. it work for me.
Paul
- Mark as New
- Bookmark
- Subscribe
- Mute
- Subscribe to RSS Feed
- Permalink
- Report Inappropriate Content
Hi Paul,
If you got the answer close this thread by giving Correct & Helpful Answers.
Regards,
Jagan.