Unlock a world of possibilities! Login now and discover the exclusive benefits awaiting you.
- Qlik Community
- :
- Forums
- :
- Analytics
- :
- New to Qlik Analytics
- :
- Re: Increase percentage in pivot tables
- Subscribe to RSS Feed
- Mark Topic as New
- Mark Topic as Read
- Float this Topic for Current User
- Bookmark
- Subscribe
- Mute
- Printer Friendly Page
- Mark as New
- Bookmark
- Subscribe
- Mute
- Subscribe to RSS Feed
- Permalink
- Report Inappropriate Content
Increase percentage in pivot tables
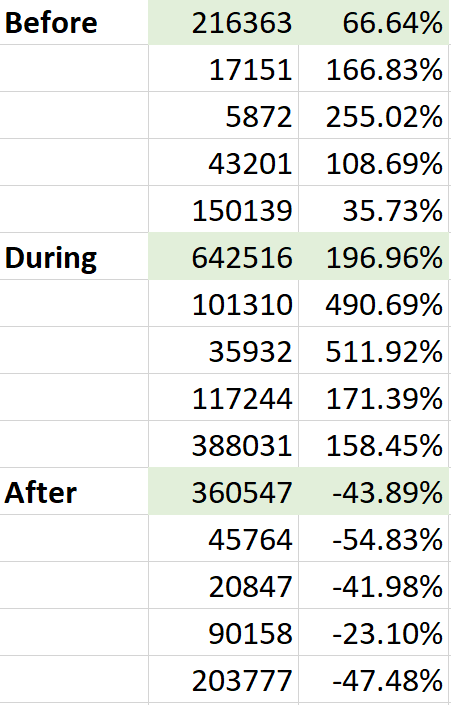
What I am trying to do is the following: I have a pivot table where as Rows I have a calculated categorical field based on 3 date intervals called Time Period (6 dates are specified through Variable Extension boxes to calculate Time Period), and another categorical variable called Ship Mode. As Columns I have Measures, and this Measures are specifically: Sales, and Profits. The look of my Pivot Table is the following:

What I would like to do is to create 2 columns called "Increase Sales" and "Increase Profits" where I could calculate percentage increases of sales and profits, but adapted automatically to the dates that the user enters via "Variable Extension" boxes. The logic of the percentage increases would be:
Before = [(Before-After) / After] x 100
During = [(During-Before) / Beforel] x 100
After = [(After-During) / During] x 100
To reproduce my example in the App I provide as attached file, the dates the user must enter via Variable Extension would be (picture below):
BeforeMin = 01.05.17
BeforeMax = 02.05.17
DuringMin = 03.05.17
DuringMax = 06.05.17
AfterMin = 07.05.17
AfterMax = 08.05.17
And the result of the desired pivot table look would be for the first column (Increase Sales):
I attach a Qlik file 100% reproducible for this question. Thanks in advance for any help Community. Anibal
- Tags:
- pivot table increase
- « Previous Replies
-
- 1
- 2
- Next Replies »
- Mark as New
- Bookmark
- Subscribe
- Mute
- Subscribe to RSS Feed
- Permalink
- Report Inappropriate Content
Fantastic Sunny. Thank you so much for your help. Anibal
- « Previous Replies
-
- 1
- 2
- Next Replies »