Unlock a world of possibilities! Login now and discover the exclusive benefits awaiting you.
Announcements
Accelerate Your Success: Fuel your data and AI journey with the right services, delivered by our experts.
Learn More
- Qlik Community
- :
- Forums
- :
- Analytics
- :
- New to Qlik Analytics
- :
- Line chart and date range
Options
- Subscribe to RSS Feed
- Mark Topic as New
- Mark Topic as Read
- Float this Topic for Current User
- Bookmark
- Subscribe
- Mute
- Printer Friendly Page
Turn on suggestions
Auto-suggest helps you quickly narrow down your search results by suggesting possible matches as you type.
Showing results for
Anonymous
Not applicable
2018-10-19
05:11 AM
- Mark as New
- Bookmark
- Subscribe
- Mute
- Subscribe to RSS Feed
- Permalink
- Report Inappropriate Content
Line chart and date range
Hi,
I'm trying to make a Vizlib line chart for my forecasting model. But as you see below, as soon as the future dates begins, Actual values hits zero.
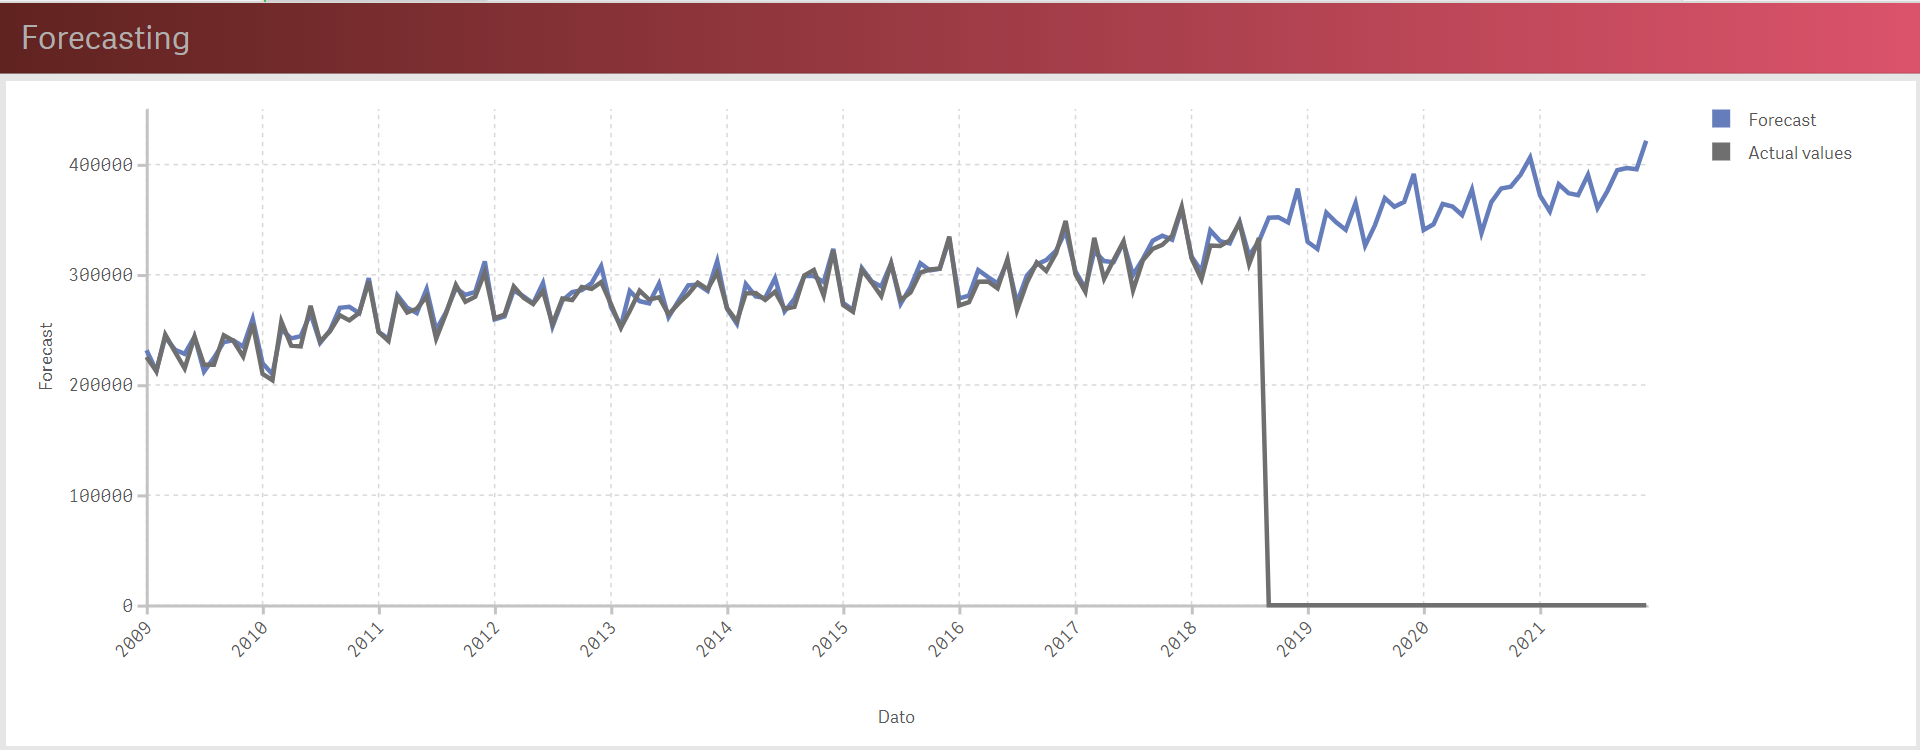
How can I make a set analysis date range only for Actual values, thus I only get a range of dates where I also have records.
My code
Forecast = Sum({<hovedbranche_kode={$(vValgtBranche)}>}yhat)
Actual values = Sum({<hovedbranche_kode={$(vValgtBranche)}>}[Brancheomsætning])
I have records until 01/08/2018.
Thanks in advance!
558 Views
0 Replies
Community Browser