Unlock a world of possibilities! Login now and discover the exclusive benefits awaiting you.
Announcements
Accelerate Your Success: Fuel your data and AI journey with the right services, delivered by our experts.
Learn More
- Qlik Community
- :
- Forums
- :
- Analytics
- :
- New to Qlik Analytics
- :
- Re: Line graph
Options
- Subscribe to RSS Feed
- Mark Topic as New
- Mark Topic as Read
- Float this Topic for Current User
- Bookmark
- Subscribe
- Mute
- Printer Friendly Page
Turn on suggestions
Auto-suggest helps you quickly narrow down your search results by suggesting possible matches as you type.
Showing results for
Not applicable
2015-05-06
07:36 AM
- Mark as New
- Bookmark
- Subscribe
- Mute
- Subscribe to RSS Feed
- Permalink
- Report Inappropriate Content
Line graph
Hi All,
I need a line graph like below and here we have to give some start date and end date for that it should produce line graph and the data point should take randomly or three months once. see the image below.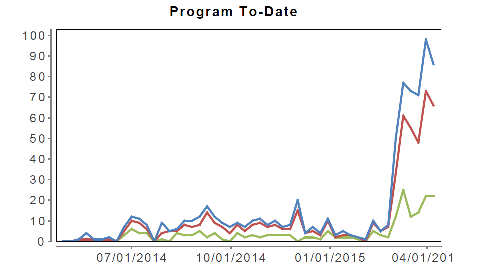
please help me.
Thanks,
Pramod
569 Views
6 Replies
Partner - Creator II
2015-05-06
07:44 AM
- Mark as New
- Bookmark
- Subscribe
- Mute
- Subscribe to RSS Feed
- Permalink
- Report Inappropriate Content
provide a sample data to try this.
450 Views
Not applicable
2015-05-06
07:50 AM
Author
- Mark as New
- Bookmark
- Subscribe
- Mute
- Subscribe to RSS Feed
- Permalink
- Report Inappropriate Content
hi all,
Sorry, PFA of sample data.
Thanks,
Pramod
450 Views
Partner - Creator II
2015-05-06
08:43 AM
- Mark as New
- Bookmark
- Subscribe
- Mute
- Subscribe to RSS Feed
- Permalink
- Report Inappropriate Content
Hi, see if this helps.
450 Views
Not applicable
2015-05-06
08:54 AM
Author
- Mark as New
- Bookmark
- Subscribe
- Mute
- Subscribe to RSS Feed
- Permalink
- Report Inappropriate Content
hi santosh,
As i am using qliksense, .qvw files won't open only data loader part will open.
Will You please send the expression?
Thanks,P
pramod
450 Views
Partner - Creator II
2015-05-06
08:59 AM
- Mark as New
- Bookmark
- Subscribe
- Mute
- Subscribe to RSS Feed
- Permalink
- Report Inappropriate Content
=sum({<Date={">=$(=vMinDate) <=$(vMaxDate)"}>}course_completed)
450 Views
Partner - Creator II
2015-05-06
09:00 AM
- Mark as New
- Bookmark
- Subscribe
- Mute
- Subscribe to RSS Feed
- Permalink
- Report Inappropriate Content
used Min and Max dates as two different input fields
450 Views
Community Browser