Unlock a world of possibilities! Login now and discover the exclusive benefits awaiting you.
- Qlik Community
- :
- Forums
- :
- Analytics
- :
- New to Qlik Analytics
- :
- Rangesum with 2 dimensions in chart
Options
- Subscribe to RSS Feed
- Mark Topic as New
- Mark Topic as Read
- Float this Topic for Current User
- Bookmark
- Subscribe
- Mute
- Printer Friendly Page
Turn on suggestions
Auto-suggest helps you quickly narrow down your search results by suggesting possible matches as you type.
Showing results for
Contributor
2018-08-29
04:08 AM
- Mark as New
- Bookmark
- Subscribe
- Mute
- Subscribe to RSS Feed
- Permalink
- Report Inappropriate Content
Rangesum with 2 dimensions in chart
hi,
I am looking for a solution
I have such sample data:
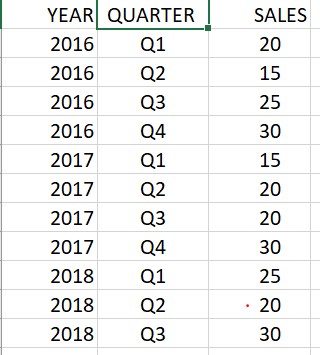
I made a chart with sums of cumulative function:
=RangeSum(Above(TOTAL Sum([SALES]), 0, RowNo(TOTAL)))
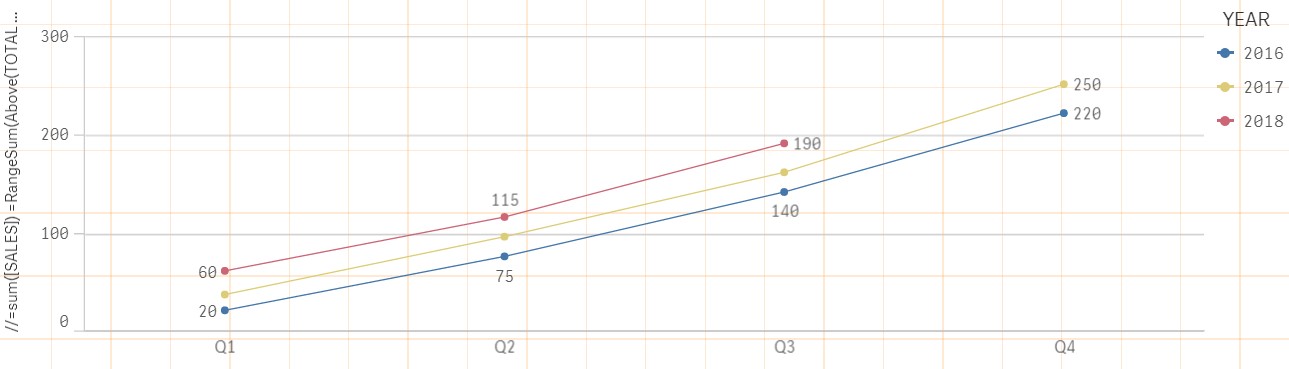
On the chart I have a sum for all the years and previous months and I want to sum up each year separately.
So, for example, for 2018 year (Q1,Q2,Q3) – RangeSum – (25,45,75) and for 2017 year (15,35,55,85) on chart,
can someone help me.
643 Views
1 Reply
Contributor
2018-08-30
06:39 AM
Author
- Mark as New
- Bookmark
- Subscribe
- Mute
- Subscribe to RSS Feed
- Permalink
- Report Inappropriate Content
I searched and found a solution:
Aggr(RangeSum(Above(Sum(SALES),0,RowNo())),YEAR,QUARTER)
Who searches does not err 
599 Views
Community Browser