Unlock a world of possibilities! Login now and discover the exclusive benefits awaiting you.
- Qlik Community
- :
- Forums
- :
- Analytics
- :
- New to Qlik Analytics
- :
- Re: Regarding Pie chart
- Subscribe to RSS Feed
- Mark Topic as New
- Mark Topic as Read
- Float this Topic for Current User
- Bookmark
- Subscribe
- Mute
- Printer Friendly Page
- Mark as New
- Bookmark
- Subscribe
- Mute
- Subscribe to RSS Feed
- Permalink
- Report Inappropriate Content
Regarding Pie chart
Hi team,
Am new to qlik sense . I need to create one pie chart based on below requirement.
For example my pivot table contains 4 fields like item id,vendor_name ,Buyer_name,Spend_Amount,when I have to create pie chart it will not show item id.It should show vendor_name and Spend_amount.
Thanks in advance.
Thanks,
Srujana.
- « Previous Replies
-
- 1
- 2
- Next Replies »
- Mark as New
- Bookmark
- Subscribe
- Mute
- Subscribe to RSS Feed
- Permalink
- Report Inappropriate Content
can you share the dummy data..?
- Mark as New
- Bookmark
- Subscribe
- Mute
- Subscribe to RSS Feed
- Permalink
- Report Inappropriate Content
Hi Priyanka,
Thank You for your replay .Please look in to the below screen shot.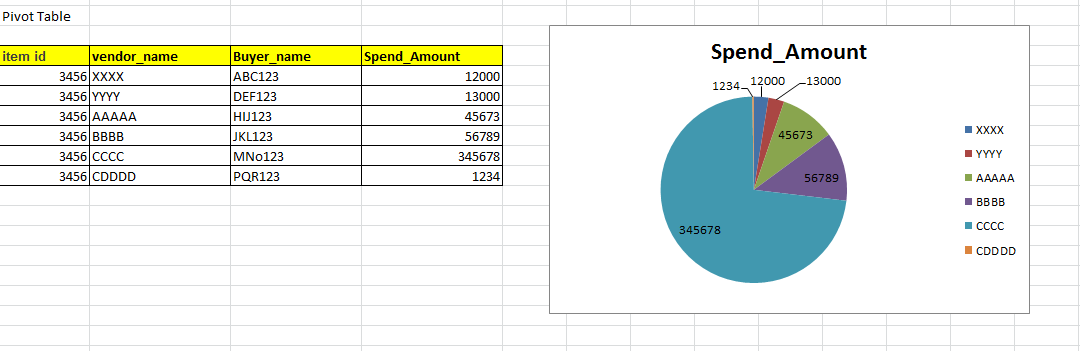
Thanks,
Srujana.
- Mark as New
- Bookmark
- Subscribe
- Mute
- Subscribe to RSS Feed
- Permalink
- Report Inappropriate Content
Hi..Srujana,
Pie charts are generally used to show percentage or proportional data and usually the percentage represented by each category but here you are trying to display many category in single PIE chart.
- Mark as New
- Bookmark
- Subscribe
- Mute
- Subscribe to RSS Feed
- Permalink
- Report Inappropriate Content
Hello Srujana,
Please refer attached application file.
P.S.: You can make use of Alternative Dimensions.
Regards!
Rahul
- Mark as New
- Bookmark
- Subscribe
- Mute
- Subscribe to RSS Feed
- Permalink
- Report Inappropriate Content
Hi Rahul,
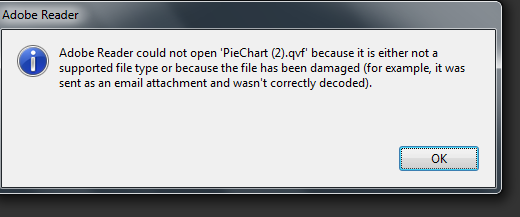
Thanks for your reply. Am not able to open the attachment.
Thanks,
Srujana.
- Mark as New
- Bookmark
- Subscribe
- Mute
- Subscribe to RSS Feed
- Permalink
- Report Inappropriate Content
Could you please share error description or screenshot of it's would be helpful.
Regards!
Rahul
- Mark as New
- Bookmark
- Subscribe
- Mute
- Subscribe to RSS Feed
- Permalink
- Report Inappropriate Content
Am opening the file with notepad and adobe reader.
- Mark as New
- Bookmark
- Subscribe
- Mute
- Subscribe to RSS Feed
- Permalink
- Report Inappropriate Content
Hello Srujana,
Please place the attached file in Qlik Sense Apps folder and then open in from Qlik Sense Desktop tool (it will listed there with name of file).
C:\Users\<UserName>Documents\Qlik\Sense\Apps
For my own machine I will place it in below path:
C:\Users\pawar_ra\Documents\Qlik\Sense\Apps
Regards!
Rahul
- Mark as New
- Bookmark
- Subscribe
- Mute
- Subscribe to RSS Feed
- Permalink
- Report Inappropriate Content
Thanks Rahul,
Am new to qlik sense ,once again thanks for your help.Now its working for me.
Thanks,
Srujana.
- « Previous Replies
-
- 1
- 2
- Next Replies »