Unlock a world of possibilities! Login now and discover the exclusive benefits awaiting you.
- Qlik Community
- :
- Forums
- :
- Analytics
- :
- New to Qlik Analytics
- :
- Re: Scatter plot and Line Chart accumulated
- Subscribe to RSS Feed
- Mark Topic as New
- Mark Topic as Read
- Float this Topic for Current User
- Bookmark
- Subscribe
- Mute
- Printer Friendly Page
- Mark as New
- Bookmark
- Subscribe
- Mute
- Subscribe to RSS Feed
- Permalink
- Report Inappropriate Content
Scatter plot and Line Chart accumulated
Hi,
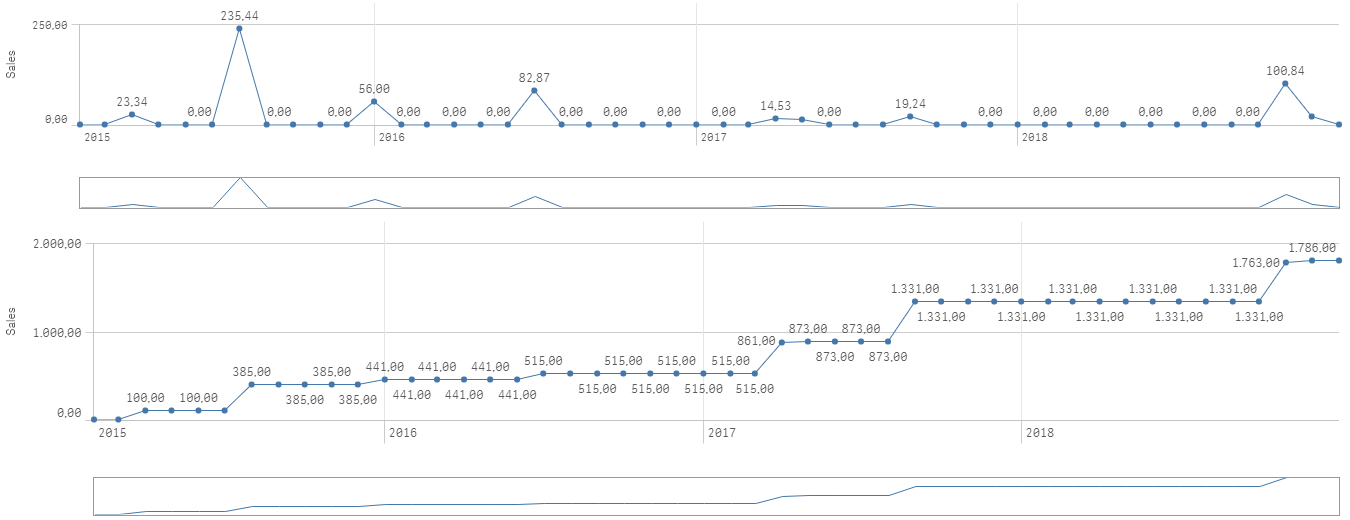
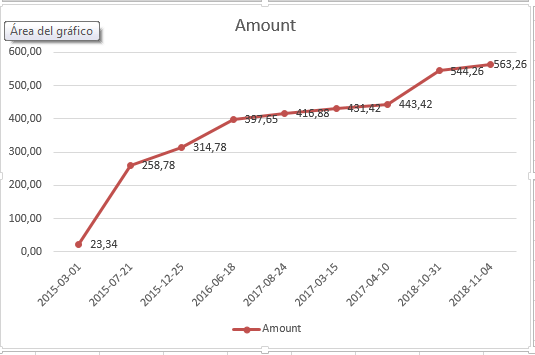
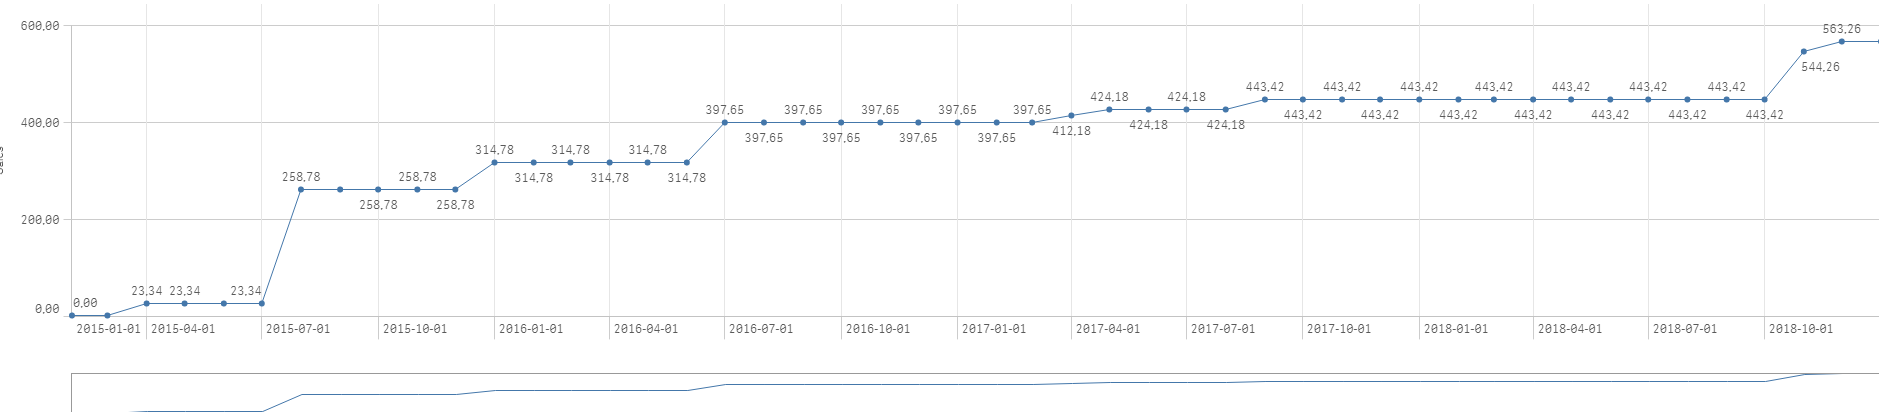
I need some help with two charts. On the one hand, I have a line chart that shows the accumulated amount on each end of the month date. I have created a calendar that takes me all the previous dates of each end of the month. In the graph of lines below in original currency works correctly. In the top one I added the exchange rate and I no longer get the accumulated amount.
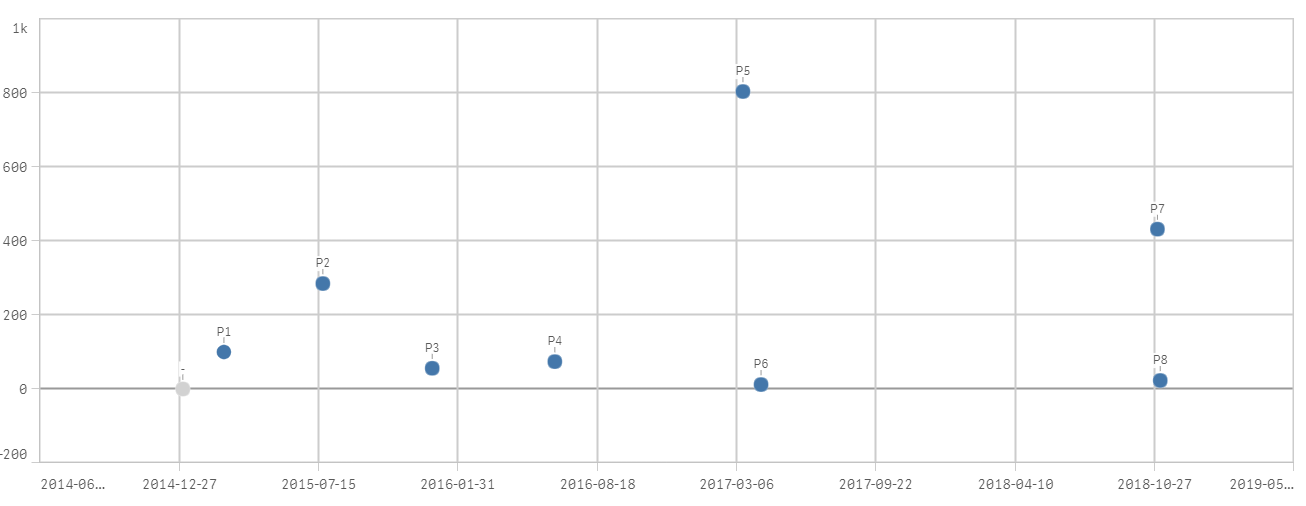
On the other hand, I have a scatter chart. The program P5 exists twice with different amounts and dates but only appears once and I would need to show two with the different amounts and dates.
I attach a qvf with the 2 charts.
Thank you very much in advance.
- « Previous Replies
-
- 1
- 2
- Next Replies »
- Mark as New
- Bookmark
- Subscribe
- Mute
- Subscribe to RSS Feed
- Permalink
- Report Inappropriate Content
For that program it's correct but not for the rest. It should be:
| PROGRAM | DATE | Amount € | Accumulated |
| P1 | 2015-03-01 | 23,34 | 23,34 |
| P2 | 2015-07-21 | 235,44 | 258,78 |
| P3 | 2015-12-25 | 56,00 | 314,78 |
| P4 | 2016-06-18 | 82,87 | 397,65 |
| P5 | 2017-08-24 | 19,24 | 416,88 |
| P5 | 2017-03-15 | 14,53 | 431,42 |
| P6 | 2017-04-10 | 12,00 | 443,42 |
| P7 | 2018-10-31 | 100,84 | 544,26 |
| P8 | 2018-11-04 | 19,00 | 563,26 |
- Mark as New
- Bookmark
- Subscribe
- Mute
- Subscribe to RSS Feed
- Permalink
- Report Inappropriate Content
Try this
Sum(AMOUNT*(If(IsNull(FX_VALUE), 1, FX_VALUE)))
- Mark as New
- Bookmark
- Subscribe
- Mute
- Subscribe to RSS Feed
- Permalink
- Report Inappropriate Content
it works but I need to use the variable to calculate the exchange rate. In this example i don't use set analysis but in my real app I need it because the exchange rate table has a date that i need to filter with the reporting date filtered by the user
- Mark as New
- Bookmark
- Subscribe
- Mute
- Subscribe to RSS Feed
- Permalink
- Report Inappropriate Content
Use set analysis like this
Sum({<SetAnalysis>}AMOUNT*(If(IsNull(FX_VALUE), 1, FX_VALUE)))
- Mark as New
- Bookmark
- Subscribe
- Mute
- Subscribe to RSS Feed
- Permalink
- Report Inappropriate Content
It's not working well. I upgrade the example with that condition and with reporting date as today I dont get the expected results (I expect the same results obtained with the previous data).
I attach the new qvf.
Thank you so much for your help!
- « Previous Replies
-
- 1
- 2
- Next Replies »