Unlock a world of possibilities! Login now and discover the exclusive benefits awaiting you.
- Qlik Community
- :
- Forums
- :
- Analytics
- :
- New to Qlik Analytics
- :
- Re: Set Analysis on Qlik Sense
- Subscribe to RSS Feed
- Mark Topic as New
- Mark Topic as Read
- Float this Topic for Current User
- Bookmark
- Subscribe
- Mute
- Printer Friendly Page
- Mark as New
- Bookmark
- Subscribe
- Mute
- Subscribe to RSS Feed
- Permalink
- Report Inappropriate Content
Set Analysis on Qlik Sense
Hello,
Where can I find documentation about this?
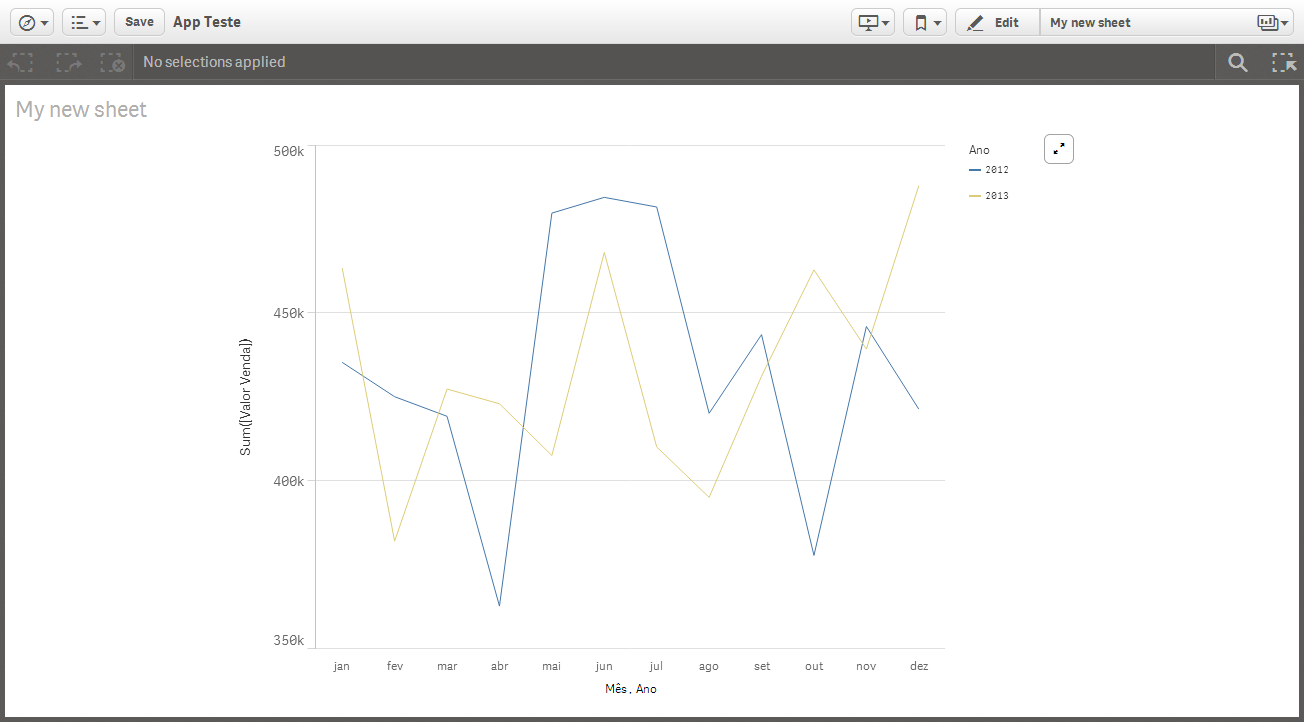
How can I create a visualization with year vs previous year, for example?
Thanks in advance.
Julian
- « Previous Replies
-
- 1
- 2
- Next Replies »
Accepted Solutions
- Mark as New
- Bookmark
- Subscribe
- Mute
- Subscribe to RSS Feed
- Permalink
- Report Inappropriate Content
Jaime Aguilar is correct - the syntax is the same. The best way to do this is to create fields on the fly - Dimension or Measure - using the found under the master items section when developing. You can also enter the expression for the measure or dimension from the properties panel of the chart object in the appropriate section.
Take a look at this video to see how it is done: Using The Master Library (video)
I also found this utility very helpful to learn and assist in creating Set Analysis statements:
Set Analysis Wizard for QlikView | qlikblog.at
Regards,
Michael Tarallo - Qlik
Mike Tarallo
Qlik
- Mark as New
- Bookmark
- Subscribe
- Mute
- Subscribe to RSS Feed
- Permalink
- Report Inappropriate Content
Hi,
For what I've seen in previous videos and in my first impressions from Sense, The back-end and syntaxis like set analysis will remain the same, so you can type set analysis the same way you've been doing all this time, but the interface relates more to the ajax one than to the desktop we were used to,
regards
- Mark as New
- Bookmark
- Subscribe
- Mute
- Subscribe to RSS Feed
- Permalink
- Report Inappropriate Content
Hello,
In Qlik Sense Set Analysis works similarly QlikView.

- Mark as New
- Bookmark
- Subscribe
- Mute
- Subscribe to RSS Feed
- Permalink
- Report Inappropriate Content
Jaime Aguilar is correct - the syntax is the same. The best way to do this is to create fields on the fly - Dimension or Measure - using the found under the master items section when developing. You can also enter the expression for the measure or dimension from the properties panel of the chart object in the appropriate section.
Take a look at this video to see how it is done: Using The Master Library (video)
I also found this utility very helpful to learn and assist in creating Set Analysis statements:
Set Analysis Wizard for QlikView | qlikblog.at
Regards,
Michael Tarallo - Qlik
Mike Tarallo
Qlik
- Mark as New
- Bookmark
- Subscribe
- Mute
- Subscribe to RSS Feed
- Permalink
- Report Inappropriate Content
Hello Michael,
Thanks, I was a little confused with the new color squema and I had an error on my expression.
Other question, is it possible give a dynamic name to a Dimension/Expression?
For example:
='Sales ' & Max(Year)
or
='Sales ' & Max(Year) -1
Thanks !
- Mark as New
- Bookmark
- Subscribe
- Mute
- Subscribe to RSS Feed
- Permalink
- Report Inappropriate Content
Hello Julian - good question - I will find out for you.
Mike
Mike Tarallo
Qlik
- Mark as New
- Bookmark
- Subscribe
- Mute
- Subscribe to RSS Feed
- Permalink
- Report Inappropriate Content
Hello, I tried this, but this is not working in this version
Best regards.
Tonial.
- Mark as New
- Bookmark
- Subscribe
- Mute
- Subscribe to RSS Feed
- Permalink
- Report Inappropriate Content
Julian, i think that all about set analysis and the part of script will be the same, only some things could be change but the essencialy is the same.
Good luck
Fernando
- Mark as New
- Bookmark
- Subscribe
- Mute
- Subscribe to RSS Feed
- Permalink
- Report Inappropriate Content
You cannot have a dynamically generated name for a measure in Sense
- Mark as New
- Bookmark
- Subscribe
- Mute
- Subscribe to RSS Feed
- Permalink
- Report Inappropriate Content
Hi-
Dynamic labeling on measures is not currently supported.
Thanks a lot!
- « Previous Replies
-
- 1
- 2
- Next Replies »