Unlock a world of possibilities! Login now and discover the exclusive benefits awaiting you.
- Qlik Community
- :
- Forums
- :
- Analytics
- :
- New to Qlik Analytics
- :
- Re: Strange thing regarding Map Chart
- Subscribe to RSS Feed
- Mark Topic as New
- Mark Topic as Read
- Float this Topic for Current User
- Bookmark
- Subscribe
- Mute
- Printer Friendly Page
- Mark as New
- Bookmark
- Subscribe
- Mute
- Subscribe to RSS Feed
- Permalink
- Report Inappropriate Content
Strange thing regarding Map Chart
Hi everyone,
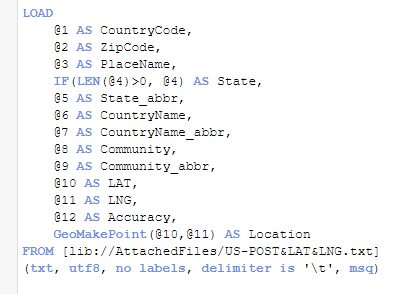
I downloaded US.zip from GeoNames, and tried to create a map chart based on zip code. This is my script:
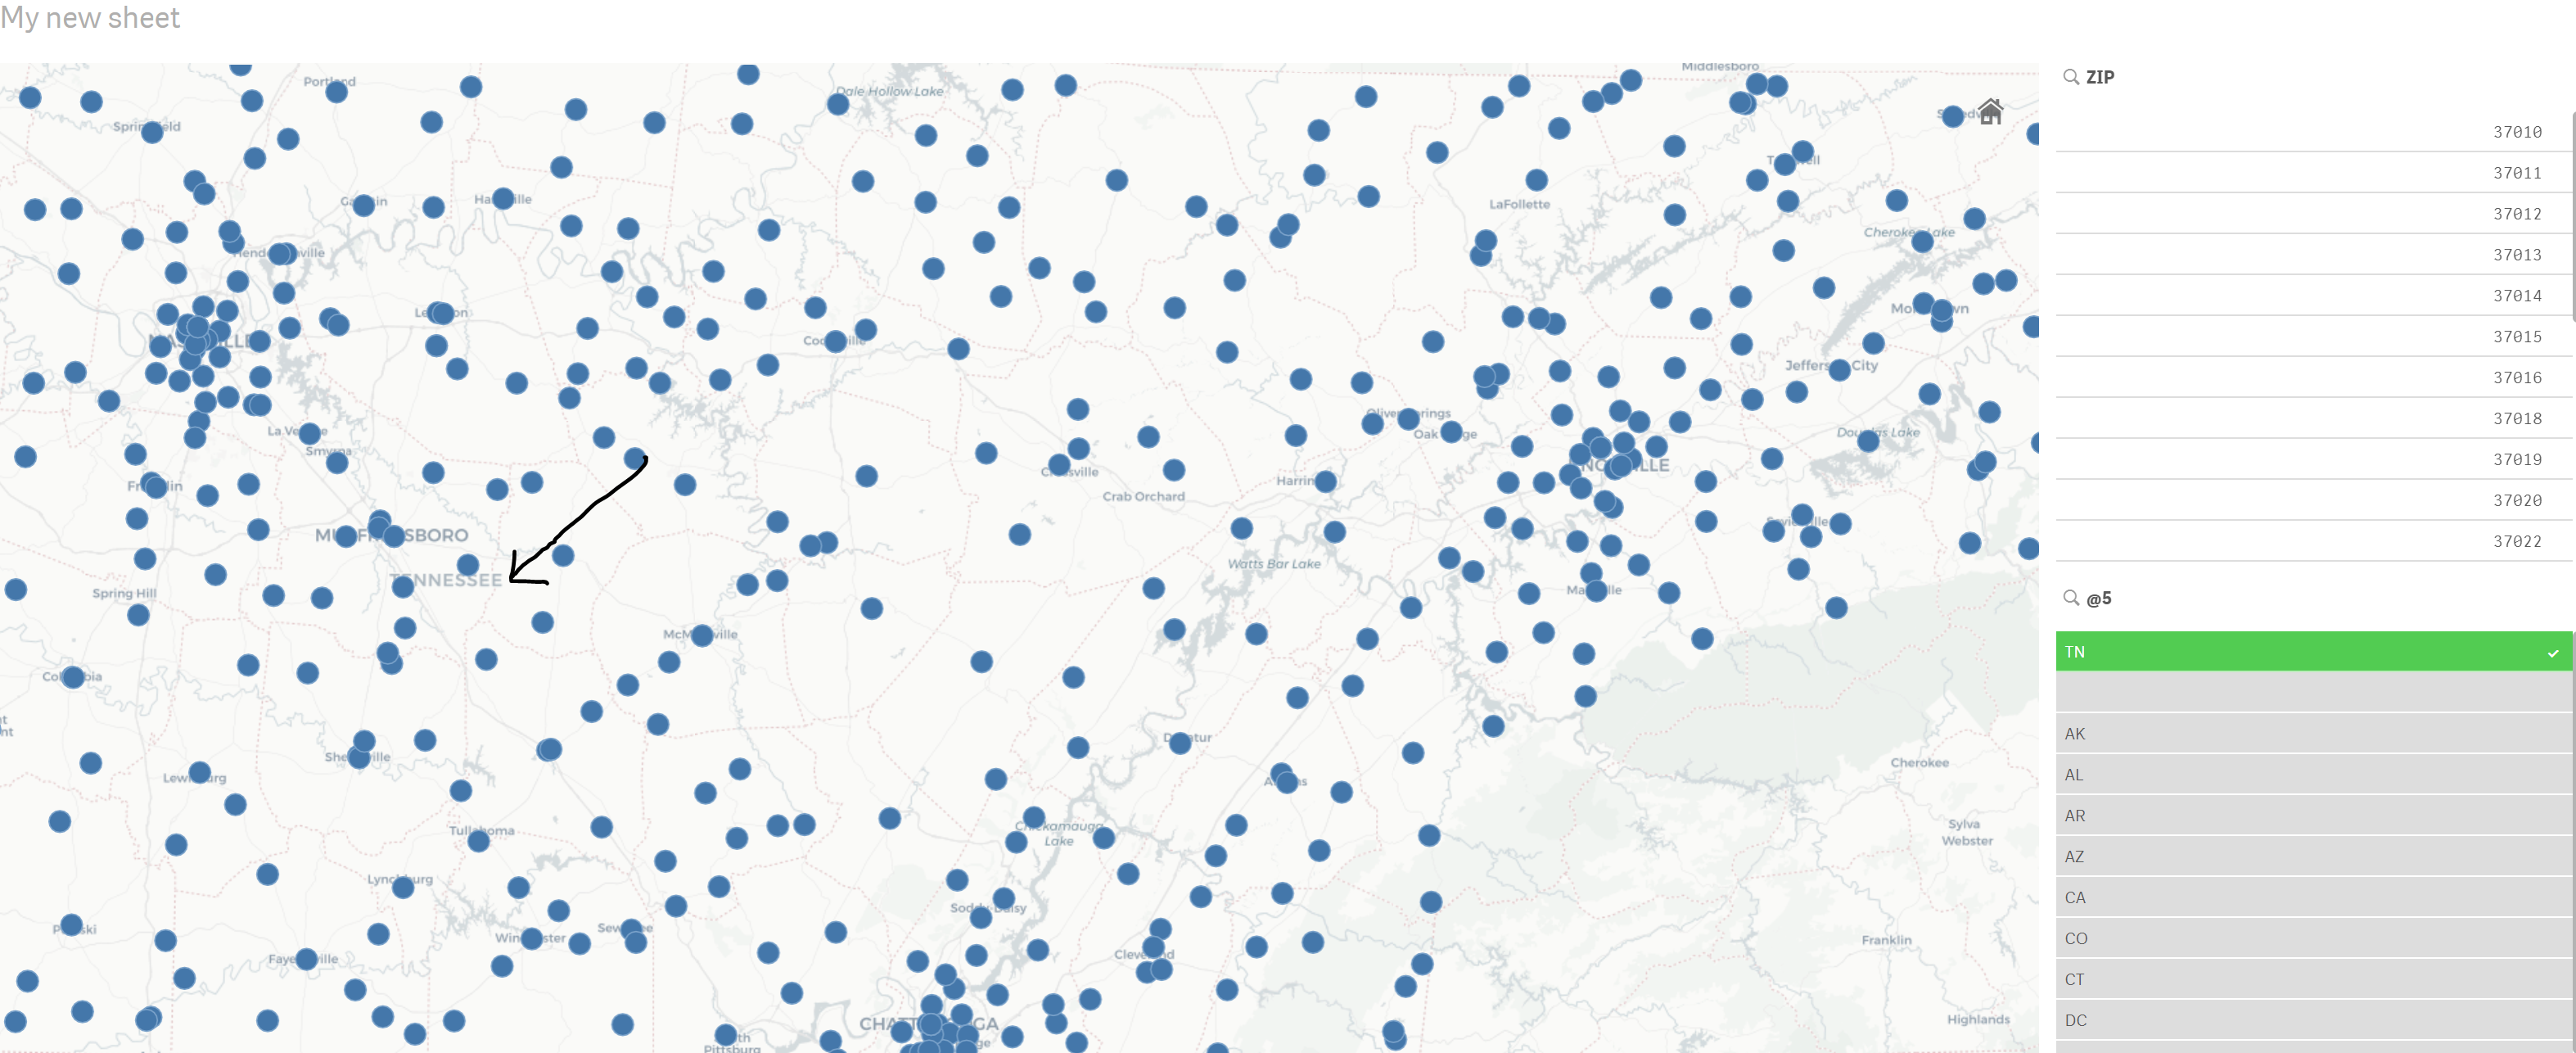
But the map shows like this:
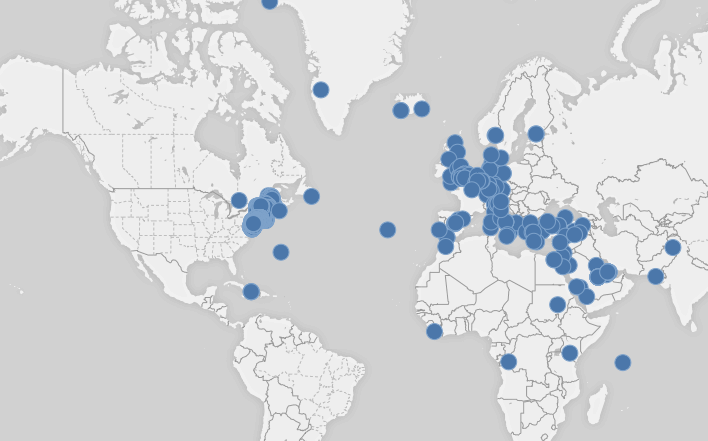
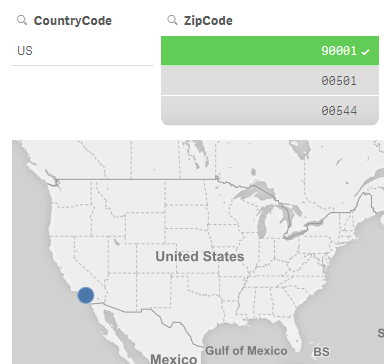
Which doesn't make sense, because all dots should be in US. And many dots are not shown. Like in CA, there is a dot with zip code 90001. It will be shown only with the filter:
Any ideas what the problem is?
- « Previous Replies
-
- 1
- 2
- Next Replies »
Accepted Solutions
- Mark as New
- Bookmark
- Subscribe
- Mute
- Subscribe to RSS Feed
- Permalink
- Report Inappropriate Content
I think this is the main issue with your data -
As per documentation the maximum number of values in a point layer map is 3333.
When I clicked on TN state, I could see all zips properly shown in the map
- Mark as New
- Bookmark
- Subscribe
- Mute
- Subscribe to RSS Feed
- Permalink
- Report Inappropriate Content
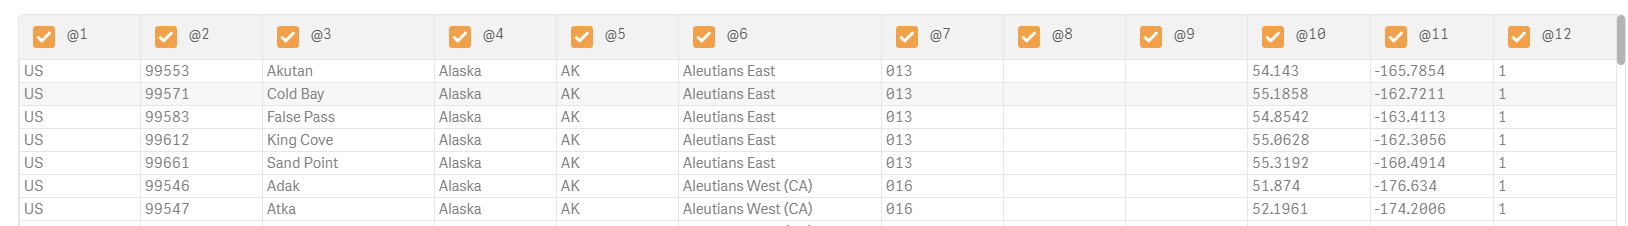
Which field you have used as zip code. I see the first field(@1) with 8-9 digit code in downloaded data from the same location. Here is what I see if I consider that field as zip code.

- Mark as New
- Bookmark
- Subscribe
- Mute
- Subscribe to RSS Feed
- Permalink
- Report Inappropriate Content
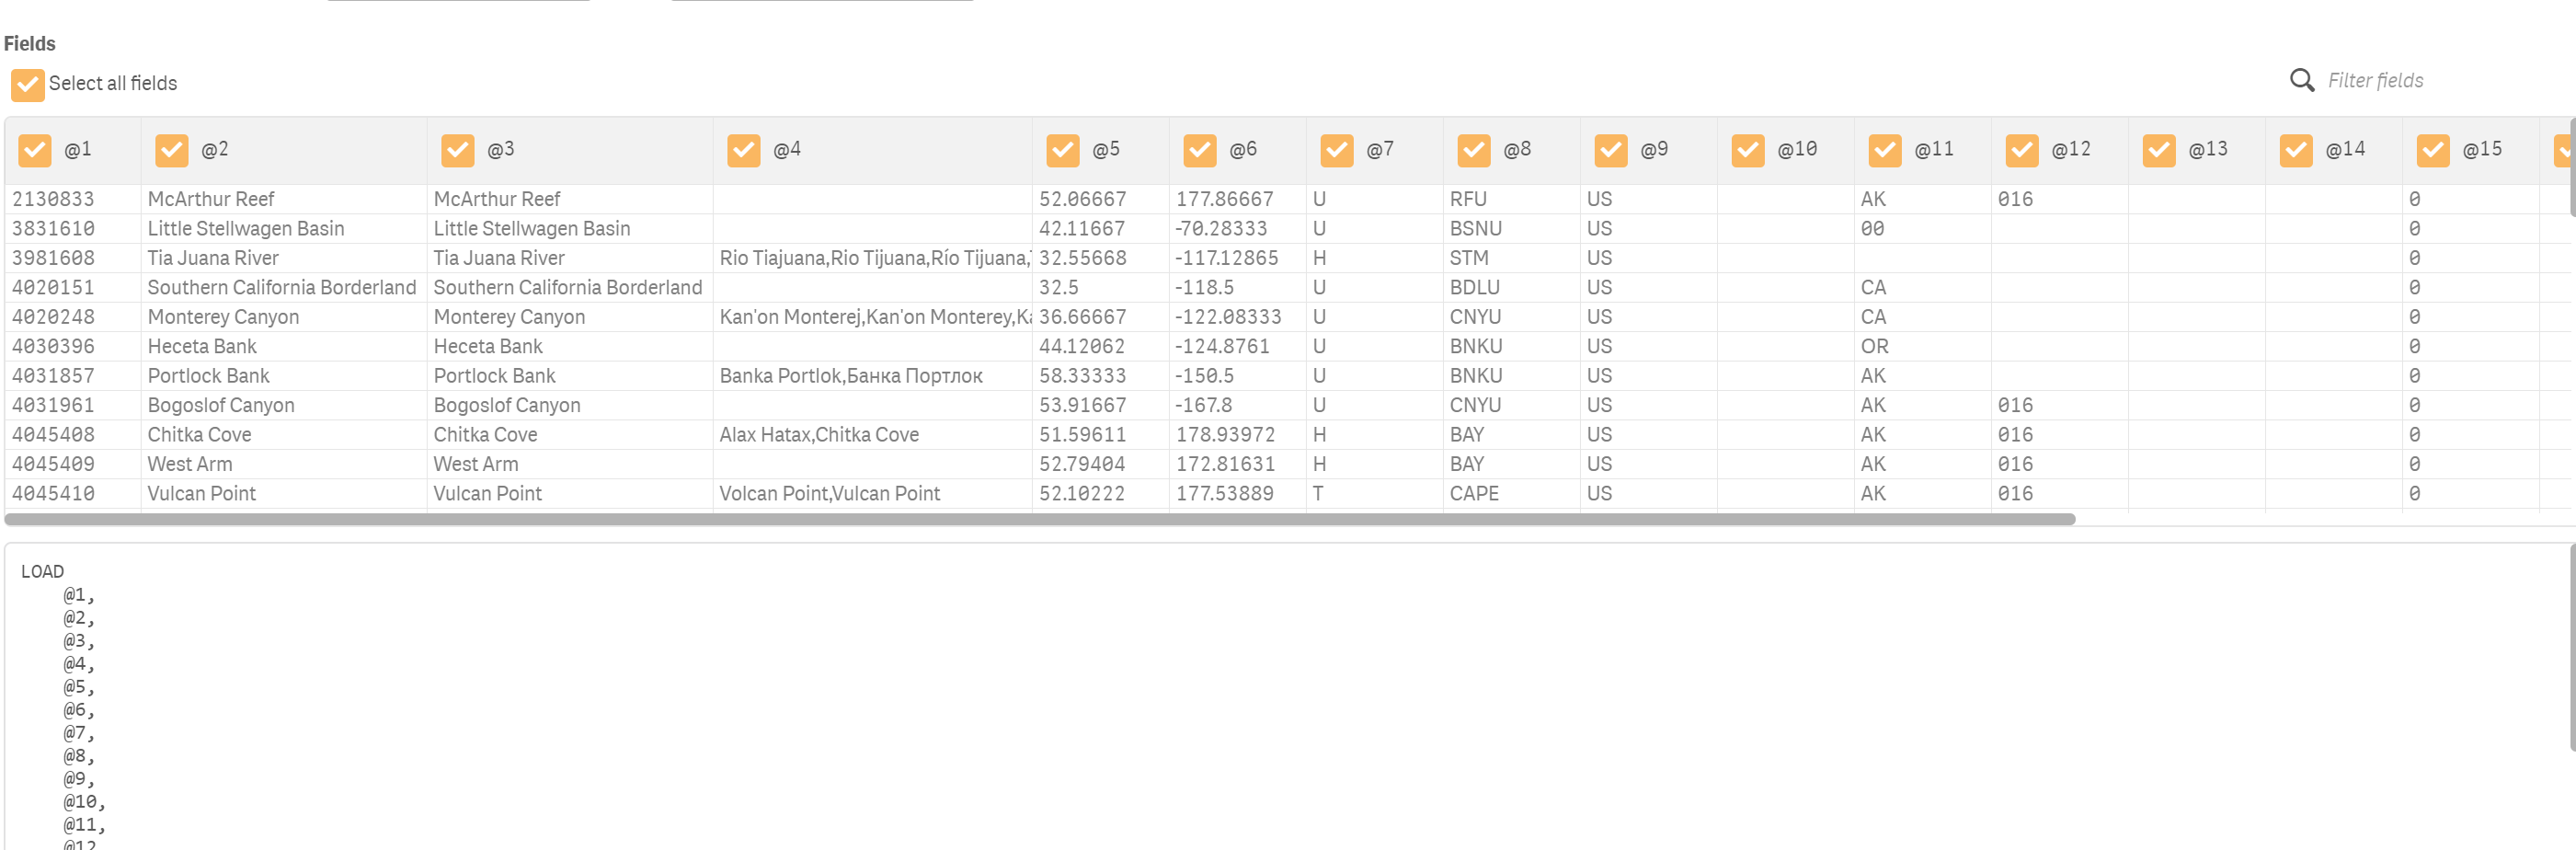
script used as below -
LOAD
@1,
@2,
@3,
@4,
@5,
@6,
@7,
@8,
@9,
@10,
@11,
@12,
@13,
@14,
@15,
@16,
@17,
@18,
@19,
GeoMakePoint(@5,@6) as Location
FROM [lib://data/US.txt]
(txt, utf8, no labels, delimiter is '\t', msq);
- Mark as New
- Bookmark
- Subscribe
- Mute
- Subscribe to RSS Feed
- Permalink
- Report Inappropriate Content
- Mark as New
- Bookmark
- Subscribe
- Mute
- Subscribe to RSS Feed
- Permalink
- Report Inappropriate Content
This is the US.txt I'm using.
- Mark as New
- Bookmark
- Subscribe
- Mute
- Subscribe to RSS Feed
- Permalink
- Report Inappropriate Content
Looks like mine one is different, its size is 294 MB after extract. But I took it from the same location -

- Mark as New
- Bookmark
- Subscribe
- Mute
- Subscribe to RSS Feed
- Permalink
- Report Inappropriate Content
Could you kindly share me the file you are using?
- Mark as New
- Bookmark
- Subscribe
- Mute
- Subscribe to RSS Feed
- Permalink
- Report Inappropriate Content
Here is the one, but something is wrong, when I tried next time, I see what you have attached. Strange!
- Mark as New
- Bookmark
- Subscribe
- Mute
- Subscribe to RSS Feed
- Permalink
- Report Inappropriate Content
I think this is the main issue with your data -
As per documentation the maximum number of values in a point layer map is 3333.
When I clicked on TN state, I could see all zips properly shown in the map
- Mark as New
- Bookmark
- Subscribe
- Mute
- Subscribe to RSS Feed
- Permalink
- Report Inappropriate Content
So it's just because it exceeds the maximum number, nothing wrong with the data or what I'm doing, right?
- « Previous Replies
-
- 1
- 2
- Next Replies »