Unlock a world of possibilities! Login now and discover the exclusive benefits awaiting you.
- Qlik Community
- :
- Forums
- :
- Analytics
- :
- New to Qlik Analytics
- :
- Re: Subtotaling in Table Chart Object
- Subscribe to RSS Feed
- Mark Topic as New
- Mark Topic as Read
- Float this Topic for Current User
- Bookmark
- Subscribe
- Mute
- Printer Friendly Page
- Mark as New
- Bookmark
- Subscribe
- Mute
- Subscribe to RSS Feed
- Permalink
- Report Inappropriate Content
Subtotaling in Table Chart Object
Is there a way to Subtotal in the table chart object in QlikSense? Here's the result I'm trying to accomplish.
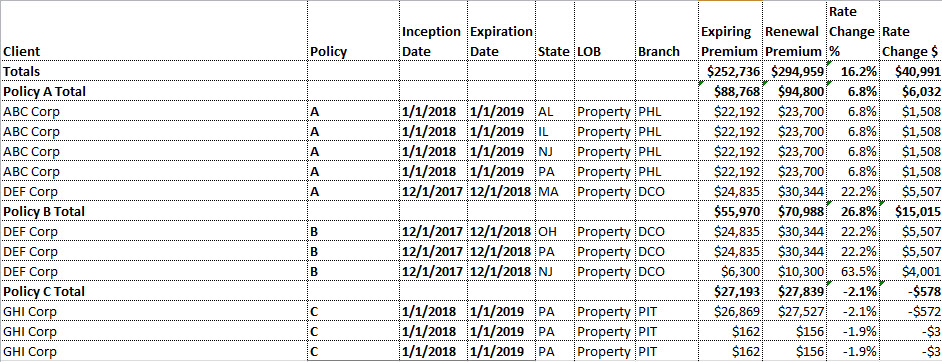
Each money column is summed. Rate Change % is a calculated field based on summed values.
- Tags:
- subtotal
- Mark as New
- Bookmark
- Subscribe
- Mute
- Subscribe to RSS Feed
- Permalink
- Report Inappropriate Content
Hi Brian,
Try converting your object to a Pivot table. You then have options of what levels to add in sub totals.
It may not get you to quite where you want to be, but if you fiddle with the settings you should be able to get close.
Hope that helps,
Steve
- Mark as New
- Bookmark
- Subscribe
- Mute
- Subscribe to RSS Feed
- Permalink
- Report Inappropriate Content
Thanks Steve. I was hoping the Table Object would have this functionality. I think the Pivot Object would require me to put Policy as a Row Dimension in order to get the subtotal. I would have thought the Sorting property of the Table object would offer this. Would you know if there is an open source Table object that has this functionality?
- Mark as New
- Bookmark
- Subscribe
- Mute
- Subscribe to RSS Feed
- Permalink
- Report Inappropriate Content
You should be able to have only row dimensions, with no column dimensions, which would then be largely the same as a straight table, just you could add the sub totals.
I don't know of an extension which behaves like you describe, but the VizLib table may be worth a look. I'm sure mahlerma will give you more info if you require.
- Mark as New
- Bookmark
- Subscribe
- Mute
- Subscribe to RSS Feed
- Permalink
- Report Inappropriate Content
Agree - this is more a Pivot Table requirement!