Unlock a world of possibilities! Login now and discover the exclusive benefits awaiting you.
- Qlik Community
- :
- Forums
- :
- Analytics
- :
- New to Qlik Analytics
- :
- Top Suppliers for 80% Spend
- Subscribe to RSS Feed
- Mark Topic as New
- Mark Topic as Read
- Float this Topic for Current User
- Bookmark
- Subscribe
- Mute
- Printer Friendly Page
- Mark as New
- Bookmark
- Subscribe
- Mute
- Subscribe to RSS Feed
- Permalink
- Report Inappropriate Content
Top Suppliers for 80% Spend
Hello everyone,
I have these transactions data.
| Product | Supplier | Spend |
| Product A | Supplier 1 | 2000 |
| Product A | Supplier 2 | 1200 |
| Product A | Supplier 3 | 700 |
| Product A | Supplier 4 | 500 |
| Product A | Supplier 5 | 500 |
| Product A | Supplier 6 | 400 |
| Product A | Supplier 7 | 350 |
| Product A | Supplier 8 | 325 |
| Product A | Supplier 9 | 250 |
| Product A | Supplier 10 | 200 |
| Product B | Supplier 1 | 2000 |
| Product B | Supplier 2 | 1500 |
| Product B | Supplier 3 | 750 |
| Product B | Supplier 1 | 700 |
| Product B | Supplier 2 | 700 |
| Product B | Supplier 3 | 400 |
| Product B | Supplier 4 | 650 |
| Product B | Supplier 5 | 200 |
| Product B | Supplier 6 | 100 |
| Product C | Supplier 1 | 250 |
| Product C | Supplier 2 | 250 |
| Product C | Supplier 3 | 200 |
| Product C | Supplier 4 | 200 |
| Product C | Supplier 5 | 150 |
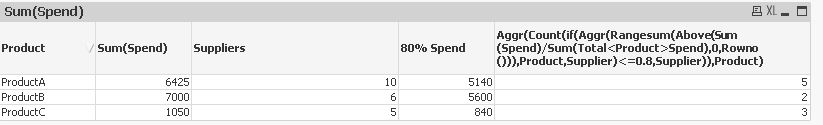
I would like to create this following report (in pivot table or table). I can't seem to get the last column, which is the count (distinct) of Suppliers contributing up to 80% of the spend for each Product.
| Product | Spend | # of Suppliers (Distinct) | 80% Spend | # of Suppliers (Distinct - 80% Spend) |
| Product A | 6425 | 10 | 5140 | 5 |
| Product B | 7000 | 6 | 5640 | 3 |
| Product C | 1050 | 5 | 840 | 3 |
Could anyone please help advise me on what expressions should i use to get that last column? Many thanks in advance!
- « Previous Replies
-
- 1
- 2
- Next Replies »
Accepted Solutions
- Mark as New
- Bookmark
- Subscribe
- Mute
- Subscribe to RSS Feed
- Permalink
- Report Inappropriate Content
- Mark as New
- Bookmark
- Subscribe
- Mute
- Subscribe to RSS Feed
- Permalink
- Report Inappropriate Content
Hi Stewart,
Try this on Straight table:

Regards!
- Mark as New
- Bookmark
- Subscribe
- Mute
- Subscribe to RSS Feed
- Permalink
- Report Inappropriate Content
There are number of ways t o do that:
* Use dimension limits they are too fast and worth
* Use calculated dimension this is time consuming one.
- Mark as New
- Bookmark
- Subscribe
- Mute
- Subscribe to RSS Feed
- Permalink
- Report Inappropriate Content
Sorry, I posted this question on a wrong forum. I'm actually using Qlik Sense (not Qlik View).
- Mark as New
- Bookmark
- Subscribe
- Mute
- Subscribe to RSS Feed
- Permalink
- Report Inappropriate Content
HI,
I am not sure how you work out the last column i..e the logic that is used.
Other than that you can use a use a straight table from charts.
Dimension would be Product.
Expressions
Spend = Sum(Spend)
# of suppliers = Count(DISTINCT Supplier)
80% of spend = SUM(Spend)*0.80
Mark
- Mark as New
- Bookmark
- Subscribe
- Mute
- Subscribe to RSS Feed
- Permalink
- Report Inappropriate Content
Moved to "New to Qlik Sense".
- Mark as New
- Bookmark
- Subscribe
- Mute
- Subscribe to RSS Feed
- Permalink
- Report Inappropriate Content
Check this if it can be of any help -

- Mark as New
- Bookmark
- Subscribe
- Mute
- Subscribe to RSS Feed
- Permalink
- Report Inappropriate Content
Hi Stewart,
This document will help you how to achieve this:
Qlik Design Blog : Recipe for a Pareto Analysis | Qlik Community
- Mark as New
- Bookmark
- Subscribe
- Mute
- Subscribe to RSS Feed
- Permalink
- Report Inappropriate Content
Wow, the formula looks quite complicated.
This is exactly what I needed. It works flawlessly. Thanks so much!
- Mark as New
- Bookmark
- Subscribe
- Mute
- Subscribe to RSS Feed
- Permalink
- Report Inappropriate Content
I think this only works if the LOAD order of supplier is already listing the suppliers by Spend descending for every Product, like in your sample data, but I doubt that your real data will show the same property.
- « Previous Replies
-
- 1
- 2
- Next Replies »