Unlock a world of possibilities! Login now and discover the exclusive benefits awaiting you.
- Qlik Community
- :
- Forums
- :
- Analytics
- :
- New to Qlik Analytics
- :
- Trendline
- Subscribe to RSS Feed
- Mark Topic as New
- Mark Topic as Read
- Float this Topic for Current User
- Bookmark
- Subscribe
- Mute
- Printer Friendly Page
- Mark as New
- Bookmark
- Subscribe
- Mute
- Subscribe to RSS Feed
- Permalink
- Report Inappropriate Content
Trendline
Hello,
I have the following table:
| Command | NB ITEMS | COST |
| Commad 1 | 6 | 50 |
| Commad 2 | 4 | 30 |
| Commad 3 | 5 | 35 |
| Commad 4 | 10 | 60 |
| Commad 5 | 5 | 35 |
| Commad 6 | 14 | 65 |
| Commad 7 | 8 | 55 |
| Commad 8 | 10 | 45 |
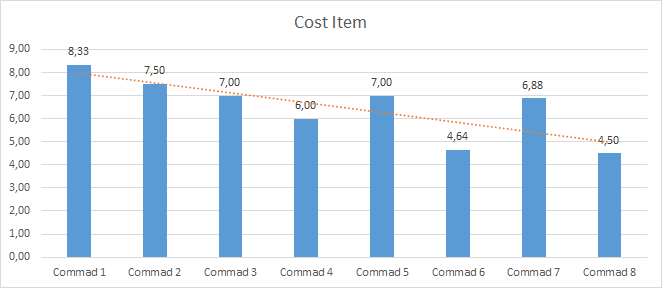
And I created a graph of average item cost per command, but I need to add a trend line. I tried multiple ideas posted on the community but I did not succeed to have my trend line.
Example:
- linest_m(total aggr(if(COST/[NB ITEMS],COST/[NB ITEMS]),Command),Command)*
- only({1}Command)+linest_b(total aggr(if(COST/[NB ITEMS],COST/[NB ITEMS]),Command),Command)
bellow graph in excel, and the trendline in orange I need in qlick sense:
Thanks a lot for your help.
- Tags:
- linear trendline
Accepted Solutions
- Mark as New
- Bookmark
- Subscribe
- Mute
- Subscribe to RSS Feed
- Permalink
- Report Inappropriate Content
First ,
Create a new dimension is ur script (numeric) as follow:
subfield(Command,' ',2) as CommandNum, (this is to transform ur commands from command 1 to 1 etc
then, use a combined graph;
as dimension:
='Command '&CommandNum
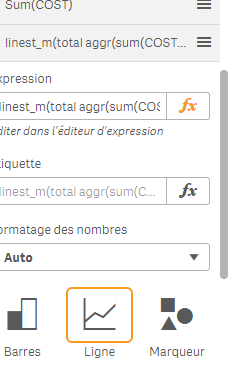
as a measure:
1)sum(COST) / Sum([NB ITEMS]) : as bar
2)
linest_m(total aggr(sum(COST) / Sum([NB ITEMS]),CommandNum),CommandNum)*CommandNum
+linest_b(total aggr(sum(COST) / Sum([NB ITEMS]),CommandNum),CommandNum) : as line
sort as follow:
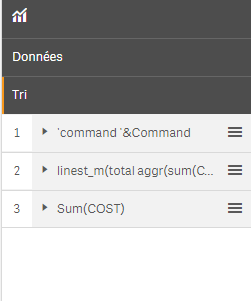
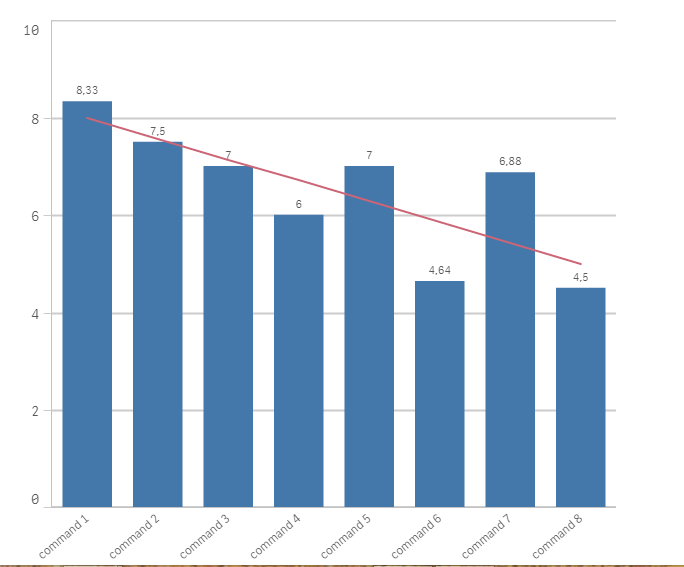
result:
- Mark as New
- Bookmark
- Subscribe
- Mute
- Subscribe to RSS Feed
- Permalink
- Report Inappropriate Content
- Mark as New
- Bookmark
- Subscribe
- Mute
- Subscribe to RSS Feed
- Permalink
- Report Inappropriate Content
First ,
Create a new dimension is ur script (numeric) as follow:
subfield(Command,' ',2) as CommandNum, (this is to transform ur commands from command 1 to 1 etc
then, use a combined graph;
as dimension:
='Command '&CommandNum
as a measure:
1)sum(COST) / Sum([NB ITEMS]) : as bar
2)
linest_m(total aggr(sum(COST) / Sum([NB ITEMS]),CommandNum),CommandNum)*CommandNum
+linest_b(total aggr(sum(COST) / Sum([NB ITEMS]),CommandNum),CommandNum) : as line
sort as follow:
result:
- Mark as New
- Bookmark
- Subscribe
- Mute
- Subscribe to RSS Feed
- Permalink
- Report Inappropriate Content
Many Thanks! The step I missed is X axis should be numeric and not text.
- Mark as New
- Bookmark
- Subscribe
- Mute
- Subscribe to RSS Feed
- Permalink
- Report Inappropriate Content
Could you please help why the trend curve is not straight?