Unlock a world of possibilities! Login now and discover the exclusive benefits awaiting you.
- Qlik Community
- :
- Forums
- :
- Analytics
- :
- New to Qlik Analytics
- :
- Re: Use the Box-Plot for time Analysis; Help requi...
- Subscribe to RSS Feed
- Mark Topic as New
- Mark Topic as Read
- Float this Topic for Current User
- Bookmark
- Subscribe
- Mute
- Printer Friendly Page
- Mark as New
- Bookmark
- Subscribe
- Mute
- Subscribe to RSS Feed
- Permalink
- Report Inappropriate Content
Use the Box-Plot for time Analysis; Help required.
I've never used the Box Plot chart and was wondering if anyone could help me with it please 
In fact, what my client wants is Time Analysis to know how much time his clients would take to do their first publication / candidature / service since the creation of their account.
To do such a thing:
I created the Nb_Of_Days to do each thing in the script (publication / candidature / service)
Then I used for each:
1) a bar chart (classification of 10 slots)
2) an Histogramme with 10 Bars (to have a detailed view by day in each selection)
Now, the question is : I was wondering if this was possible to include in a Box Plot Chart (all the 3 axis)
sthing like this (excuse the horrible "art" of mine  )
)
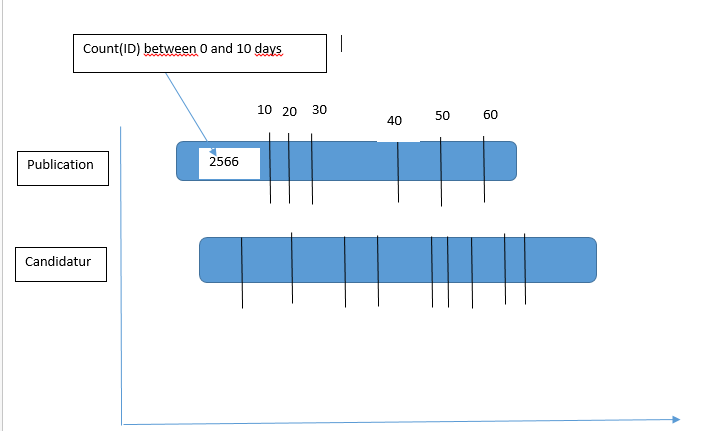
Thank u very much for ur expected help
- Mark as New
- Bookmark
- Subscribe
- Mute
- Subscribe to RSS Feed
- Permalink
- Report Inappropriate Content
hi,
but why not a stacked bar ?
in dimension :
publication/candidature/service
ceil(nb_of-days/10)*10
in expression :
count()
boxplot is more usefull for fractile
regards
- Mark as New
- Bookmark
- Subscribe
- Mute
- Subscribe to RSS Feed
- Permalink
- Report Inappropriate Content
Thank u for ur answer Olivier.
I don't have any dimension that regroups publication/candidature/service
nor have I one nb_of_days field
In fact, I have date_creation, date_publication, date_candidature, date_service
and based on that I calculate nb_of_Days_publication , nb_of_Days_Candidature, nb_of_Days_Tampon
That said, I can't figure out a way to use ur method with a stacked bar
As I said; what I was doing is sthing like this:
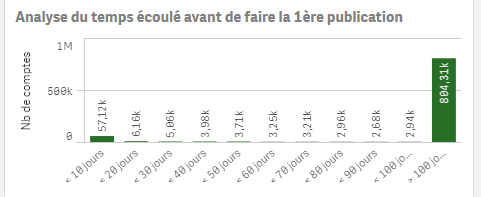
in the bar chart : (for publication)
as dimension:
if(Nb_deJours_Publication>=0 and Nb_deJours_Publication<10, '< 10 jours',
if(Nb_deJours_Publication>=10 and Nb_deJours_Publication<20, '< 20 jours',
if(Nb_deJours_Publication>=20 and Nb_deJours_Publication<30, '< 30 jours',
if(Nb_deJours_Publication>=30 and Nb_deJours_Publication<40, '< 40 jours',
if(Nb_deJours_Publication>=40 and Nb_deJours_Publication<50, '< 50 jours',
if(Nb_deJours_Publication>=50 and Nb_deJours_Publication<60, '< 60 jours',
if(Nb_deJours_Publication>=60 and Nb_deJours_Publication<70, '< 70 jours',
if(Nb_deJours_Publication>=70 and Nb_deJours_Publication<80, '< 80 jours',
if(Nb_deJours_Publication>=80 and Nb_deJours_Publication<90, '< 90 jours',
if(Nb_deJours_Publication>=90 and Nb_deJours_Publication<100,'< 100 jours',
if(Nb_deJours_Publication>=100 , '> 100 jours')))))))))))
as a measure:
count(ID_Compte)
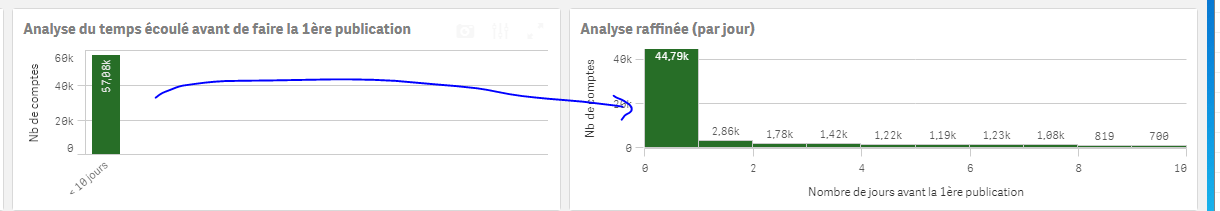
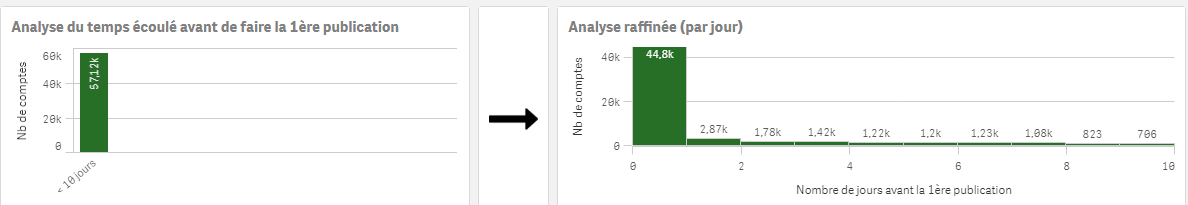
to have this:
and an histogramme as follow :
dimension:
Nb_deJours_Publication
to have this:
This process is then repeated for the candidature and service:
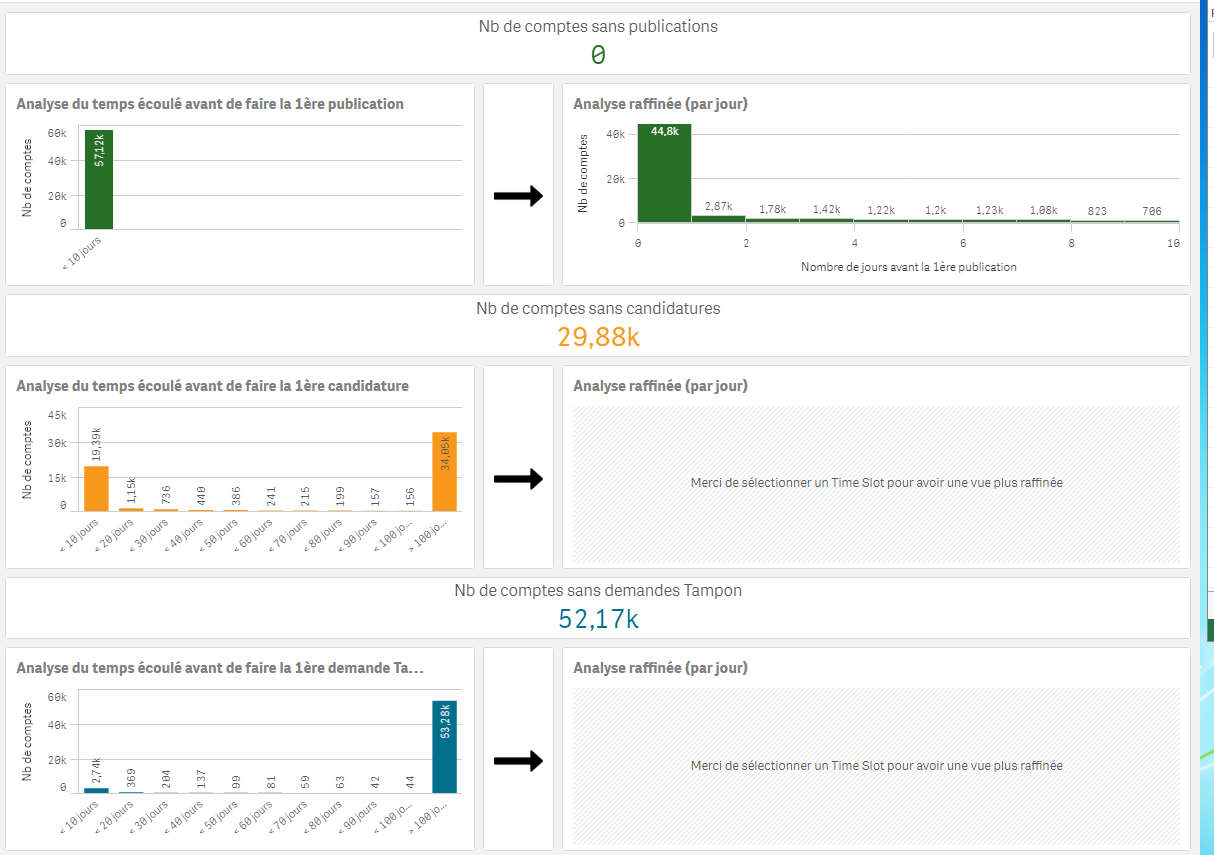
Which means, that I have to include the COUNT(ID) as a measure to build my time analysis around and find a way to regroup all of the axis in one chart..
Ps: the BoxPlot was the demand of the client; far from being mine
- Mark as New
- Bookmark
- Subscribe
- Mute
- Subscribe to RSS Feed
- Permalink
- Report Inappropriate Content
so you can use synthtic dimension with valuelist()
in dimension :
valuelist('publication','candidature','service')
in expression :
if(valuelist('publication','candidature','service') = 'publication',
count(nb_jour_pub),
if(valuelist('publication','candidature','service') = 'candidature',
etc
problem is with nb_of_days/10 because of three different field
maybe here too a synthetic dimension with valueloop(1,10)
and in expression : if(ceil or floor(nb_of_days) /10 = valueloop(1,10) then count()
I look for boxplot,
- Mark as New
- Bookmark
- Subscribe
- Mute
- Subscribe to RSS Feed
- Permalink
- Report Inappropriate Content
and even though, if we find a way to include all nb_of_days, if I'd add as a second expression count(ID), would it return accurate results?
Besides, with ValueList, the chart won't be dynamic to selections anymore and thus, we could not see its interaction with the rest of the charts/data.
Let me see if I can alter my script..
- Mark as New
- Bookmark
- Subscribe
- Mute
- Subscribe to RSS Feed
- Permalink
- Report Inappropriate Content
here is formula

and it looks like this :

I don't see with a boxplot (just two segments)
if you have some rows of data, attach them
- Mark as New
- Bookmark
- Subscribe
- Mute
- Subscribe to RSS Feed
- Permalink
- Report Inappropriate Content
How would u include the dimension here?
I mean
3 bars for 3 values: Publication/Candidature/Service (supposing we have such a dimension)
and especially the count(ID)
ps: thank u very much for ur assistance
- Mark as New
- Bookmark
- Subscribe
- Mute
- Subscribe to RSS Feed
- Permalink
- Report Inappropriate Content

et une expression pour mettre l'un des trois jours possibles :
| if(valueloop(1,3)=1,sum(if( floor(nbj1/10)*10= valueloop(0,100,10),1) | ), | |
| if(valueloop(1,3)=2,sum(if( floor(nbj2/10)*10= valueloop(0,100,10),1) | ), | |
| if(plus-value(1,3)=3,sum(if( floor(nbj3/10)*10= valueloop(0,100,10),1) )))) |

- Mark as New
- Bookmark
- Subscribe
- Mute
- Subscribe to RSS Feed
- Permalink
- Report Inappropriate Content
Merci pour ton aide Olivier; ce fut vraiment d'un apport certain !
Here's what I did,
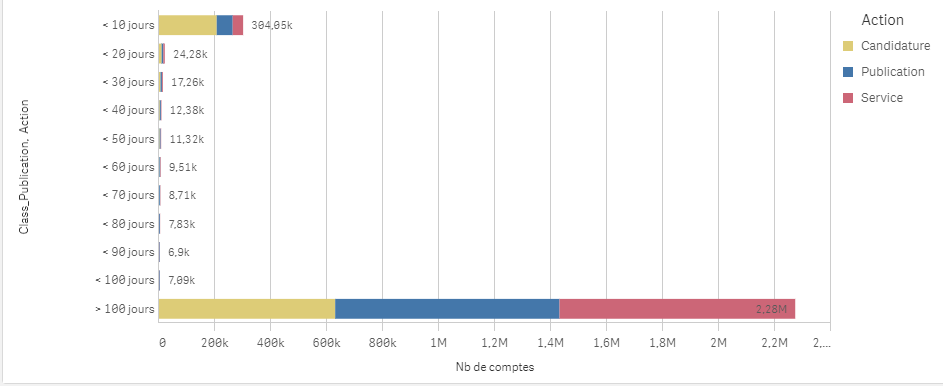
I've altered my script; now I have one dimension 'Action' that regroups the Candidature/publication and service)
I also have one Nb_deJours field
Based on that, I've created the class field in the script
Now my bar chart is as follow:
as Dimensions:
Class
Action
as a measure:
Nb_deJours
Result:
or
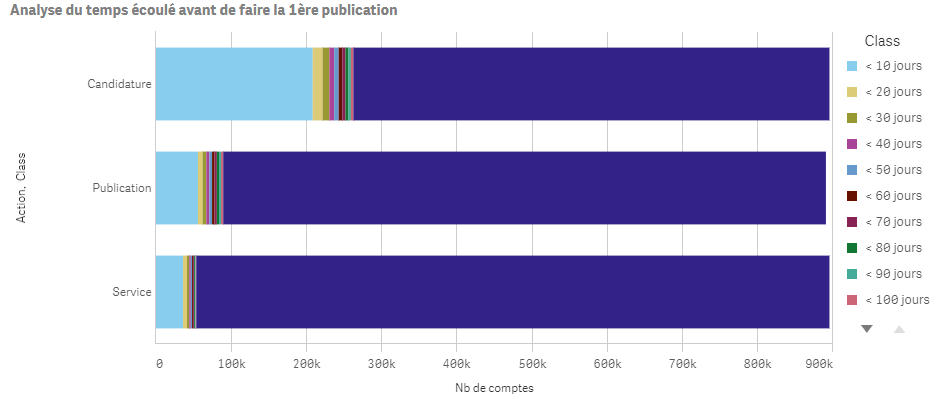
as Dimensions:
Action
Class
as a measure:
Nb_deJours
Result:
Thanks !
- Mark as New
- Bookmark
- Subscribe
- Mute
- Subscribe to RSS Feed
- Permalink
- Report Inappropriate Content
merci Omar, bon développement