Unlock a world of possibilities! Login now and discover the exclusive benefits awaiting you.
- Qlik Community
- :
- Forums
- :
- Analytics
- :
- New to Qlik Analytics
- :
- Waterfall chart with time dimension
- Subscribe to RSS Feed
- Mark Topic as New
- Mark Topic as Read
- Float this Topic for Current User
- Bookmark
- Subscribe
- Mute
- Printer Friendly Page
The message you are trying to access is permanently deleted.
- Mark as New
- Bookmark
- Subscribe
- Mute
- Subscribe to RSS Feed
- Permalink
- Report Inappropriate Content
Waterfall chart with time dimension
Hello,
i would like to create a waterfall chart with time dimension. That means I can choose between year and month and the measure are based the selection. The starting point should be the measures of the last mont. For exampel, if I want to show the sales of December 2016, the first sales measure must be November 2016 and the last one December 2016. I have taken the dynamic waterfall chart to create the waterfall chart I want. But I don´t get working.
I hope my problem is understable.
Does anybody have created something like that or know how to do it?
Thanks for every answers!
Christian
- Mark as New
- Bookmark
- Subscribe
- Mute
- Subscribe to RSS Feed
- Permalink
- Report Inappropriate Content
Would you be able to share a sample of where you have been trying this out?
- Mark as New
- Bookmark
- Subscribe
- Mute
- Subscribe to RSS Feed
- Permalink
- Report Inappropriate Content
Hello Sunny,
the sample you aked for.
I took the script structure like it is used in the example of the dynamic waterfall chart.
But I don´t know if I should include the time dimension in the script or in formula.
Thanks for your help.
Christian
- Mark as New
- Bookmark
- Subscribe
- Mute
- Subscribe to RSS Feed
- Permalink
- Report Inappropriate Content
So for right now, without selections everything looks good? All you want is that once you make a selection in particular Datum, it should show the selected month and the previous month? Do I understand this right?
- Mark as New
- Bookmark
- Subscribe
- Mute
- Subscribe to RSS Feed
- Permalink
- Report Inappropriate Content
Hi Sunny,
sorry my late response. I thought I have already answered your question.
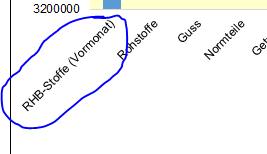
Yes, you got it right. I have a screenshot how it looks like in excel:

The bar on the left side, shows the privious month (October) and right one shows the cumulated measures of November.
I hope it makes my issue more clear.
Thanks
Christian
- Mark as New
- Bookmark
- Subscribe
- Mute
- Subscribe to RSS Feed
- Permalink
- Report Inappropriate Content
No one can help me with my problem?
- Mark as New
- Bookmark
- Subscribe
- Mute
- Subscribe to RSS Feed
- Permalink
- Report Inappropriate Content
I understand what you are looking for, but what are these dimension values here? These seems very different from the chart?
Is this the Sum of all individual values for last period? and the one on the right the same for this period and then use the in between bars to show the change?