Unlock a world of possibilities! Login now and discover the exclusive benefits awaiting you.
- Qlik Community
- :
- Forums
- :
- Analytics
- :
- New to Qlik Analytics
- :
- color by average
- Subscribe to RSS Feed
- Mark Topic as New
- Mark Topic as Read
- Float this Topic for Current User
- Bookmark
- Subscribe
- Mute
- Printer Friendly Page
- Mark as New
- Bookmark
- Subscribe
- Mute
- Subscribe to RSS Feed
- Permalink
- Report Inappropriate Content
color by average
(Count(distinct([CREATED_DT.autoCalendar.Date]))/((Count({<supervisor=>}TOTAL distinct([CREATED_DT.autoCalendar.Date])))*.75))
the above is an expression that works.
I am now trying to color by average of this column the text color.
For a color expression, how do i tell qlik to color anything above average as green and anything below average as red.
thanks!
Accepted Solutions
- Mark as New
- Bookmark
- Subscribe
- Mute
- Subscribe to RSS Feed
- Permalink
- Report Inappropriate Content
what the dimension you're using in the chart where u're using this chart?
Let's say it called MyDimension:
in this chart, under adds on, create a reference line as follow( to test if we're doing things well?)
Avg(All aggr((Count(distinct([CREATED_DT.autoCalendar.Date]))/((Count({<supervisor=>}TOTAL distinct([CREATED_DT.autoCalendar.Date])))*.75)),MyDimension))
and as an expression color:
if((Count(distinct([CREATED_DT.autoCalendar.Date]))/((Count({<supervisor=>}TOTAL distinct([CREATED_DT.autoCalendar.Date])))*.75))
>= Avg(All aggr((Count(distinct([CREATED_DT.autoCalendar.Date]))/((Count({<supervisor=>}TOTAL distinct([CREATED_DT.autoCalendar.Date])))*.75)),MyDimension))
, green(), red())
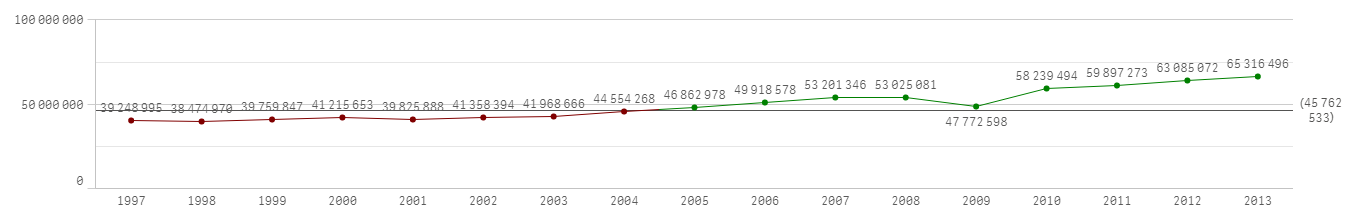
per analogy to my data, the resutlt would be:
- Mark as New
- Bookmark
- Subscribe
- Mute
- Subscribe to RSS Feed
- Permalink
- Report Inappropriate Content
what the dimension you're using in the chart where u're using this chart?
Let's say it called MyDimension:
in this chart, under adds on, create a reference line as follow( to test if we're doing things well?)
Avg(All aggr((Count(distinct([CREATED_DT.autoCalendar.Date]))/((Count({<supervisor=>}TOTAL distinct([CREATED_DT.autoCalendar.Date])))*.75)),MyDimension))
and as an expression color:
if((Count(distinct([CREATED_DT.autoCalendar.Date]))/((Count({<supervisor=>}TOTAL distinct([CREATED_DT.autoCalendar.Date])))*.75))
>= Avg(All aggr((Count(distinct([CREATED_DT.autoCalendar.Date]))/((Count({<supervisor=>}TOTAL distinct([CREATED_DT.autoCalendar.Date])))*.75)),MyDimension))
, green(), red())
per analogy to my data, the resutlt would be:
- Mark as New
- Bookmark
- Subscribe
- Mute
- Subscribe to RSS Feed
- Permalink
- Report Inappropriate Content
That worked, thank you.