Unlock a world of possibilities! Login now and discover the exclusive benefits awaiting you.
- Qlik Community
- :
- Forums
- :
- Analytics & AI
- :
- Products & Topics
- :
- Visualization and Usability
- :
- count in range
- Subscribe to RSS Feed
- Mark Topic as New
- Mark Topic as Read
- Float this Topic for Current User
- Bookmark
- Subscribe
- Mute
- Printer Friendly Page
- Mark as New
- Bookmark
- Subscribe
- Mute
- Subscribe to RSS Feed
- Permalink
- Report Inappropriate Content
count in range
Accepted Solutions
- Mark as New
- Bookmark
- Subscribe
- Mute
- Subscribe to RSS Feed
- Permalink
- Report Inappropriate Content
Hello,
If my understanding is correct, you are trying to count all the dates that fall under Monday to Friday within the timeframe 8:30 to 20:00 and Saturday within timeframe 8:30 and 13:30.
I will share with you the easiest and fastest way to achieve a similar use case scenario. If it doesn't solve your issue 100%, at least it can point you on the right path towards the resolution.
You can try following the steps below:
1. This is the dataset that I am using:
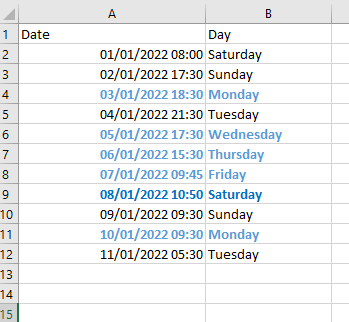
As you can see the green records are the ones that we want to count, as they are the only ones that meet the criteria mentioned above. The total count should be 6 records.
2. Now you can create 2 additional calculated fields:
- Name: DayName and expression: WeekDay(Date)
- Name: Time and expression: Num(Frac(Time(Date)))
The first dimension will give us the days as Mon, Tue, Wed, Thu, Fri, Sat, Sun and the second field will give us values such as 0.22...., 0.64..... etc.
3. Now you should have a dataset such as:
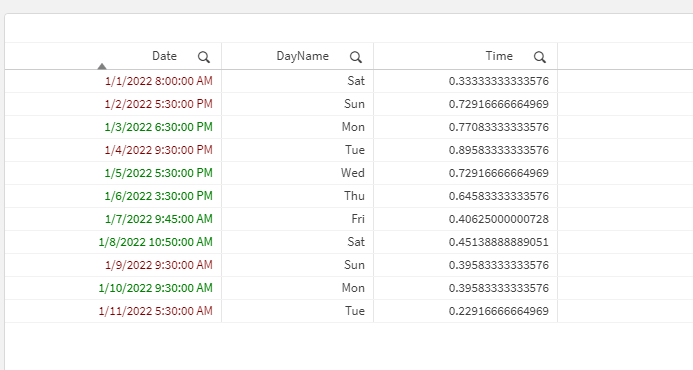
Ignore the colors, I just color the records that we need to count.
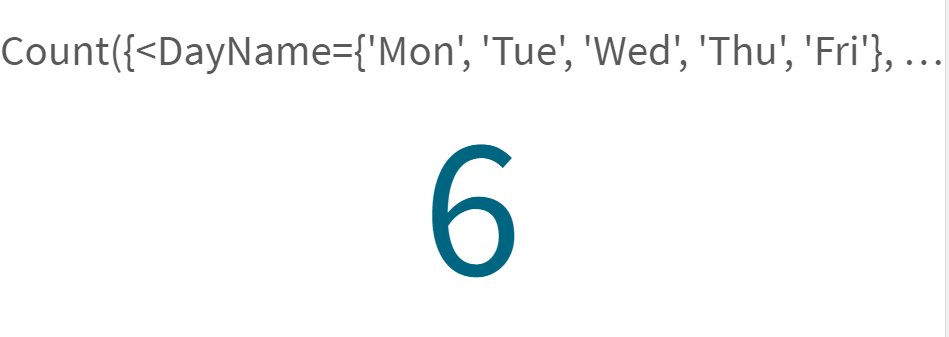
4. Now we will have to create a KPI and combine 2 different set analysis:
First set analysis is to count all the records from Mon to Fri within timeframe 8:30 to 20:00:
Count({<DayName={'Mon', 'Tue', 'Wed', 'Thu', 'Fri'}, Time={">=$(=Num(MakeTime(8,30,0)))<=$(=Num(MakeTime(20,0,0)))"}>}Date)
This will give us the number 5.
Then we should use a set analysis for counting all the records of Sat within timeframe 8:30 and 13:30:
Count({<DayName={'Sat'}, Time={">=$(=Num(MakeTime(8,30,0)))<=$(=Num(MakeTime(13,30,0)))"}>}Date)
This will give us the number 1.
Combining both together:
=Count({<DayName={'Mon', 'Tue', 'Wed', 'Thu', 'Fri'}, Time={">=$(=Num(MakeTime(8,30,0)))<=$(=Num(MakeTime(20,0,0)))"}>}Date) + Count({<DayName={'Sat'}, Time={">=$(=Num(MakeTime(8,30,0)))<=$(=Num(MakeTime(13,30,0)))"}>}Date)
Will give us the number 6 which the the right amount of records that we want to count
I hope that this information was helpful. In case I have misunderstood the use case scenario, please elaborate in details by providing additional information. However, if it has helped you resolve the issue, please mark it as accepted solution to give further visibility to other community members.
- Mark as New
- Bookmark
- Subscribe
- Mute
- Subscribe to RSS Feed
- Permalink
- Report Inappropriate Content
Hello,
If my understanding is correct, you are trying to count all the dates that fall under Monday to Friday within the timeframe 8:30 to 20:00 and Saturday within timeframe 8:30 and 13:30.
I will share with you the easiest and fastest way to achieve a similar use case scenario. If it doesn't solve your issue 100%, at least it can point you on the right path towards the resolution.
You can try following the steps below:
1. This is the dataset that I am using:
As you can see the green records are the ones that we want to count, as they are the only ones that meet the criteria mentioned above. The total count should be 6 records.
2. Now you can create 2 additional calculated fields:
- Name: DayName and expression: WeekDay(Date)
- Name: Time and expression: Num(Frac(Time(Date)))
The first dimension will give us the days as Mon, Tue, Wed, Thu, Fri, Sat, Sun and the second field will give us values such as 0.22...., 0.64..... etc.
3. Now you should have a dataset such as:
Ignore the colors, I just color the records that we need to count.
4. Now we will have to create a KPI and combine 2 different set analysis:
First set analysis is to count all the records from Mon to Fri within timeframe 8:30 to 20:00:
Count({<DayName={'Mon', 'Tue', 'Wed', 'Thu', 'Fri'}, Time={">=$(=Num(MakeTime(8,30,0)))<=$(=Num(MakeTime(20,0,0)))"}>}Date)
This will give us the number 5.
Then we should use a set analysis for counting all the records of Sat within timeframe 8:30 and 13:30:
Count({<DayName={'Sat'}, Time={">=$(=Num(MakeTime(8,30,0)))<=$(=Num(MakeTime(13,30,0)))"}>}Date)
This will give us the number 1.
Combining both together:
=Count({<DayName={'Mon', 'Tue', 'Wed', 'Thu', 'Fri'}, Time={">=$(=Num(MakeTime(8,30,0)))<=$(=Num(MakeTime(20,0,0)))"}>}Date) + Count({<DayName={'Sat'}, Time={">=$(=Num(MakeTime(8,30,0)))<=$(=Num(MakeTime(13,30,0)))"}>}Date)
Will give us the number 6 which the the right amount of records that we want to count
I hope that this information was helpful. In case I have misunderstood the use case scenario, please elaborate in details by providing additional information. However, if it has helped you resolve the issue, please mark it as accepted solution to give further visibility to other community members.