Unlock a world of possibilities! Login now and discover the exclusive benefits awaiting you.
- Qlik Community
- :
- Forums
- :
- Analytics
- :
- New to Qlik Analytics
- :
- max count as a reference line
- Subscribe to RSS Feed
- Mark Topic as New
- Mark Topic as Read
- Float this Topic for Current User
- Bookmark
- Subscribe
- Mute
- Printer Friendly Page
- Mark as New
- Bookmark
- Subscribe
- Mute
- Subscribe to RSS Feed
- Permalink
- Report Inappropriate Content
max count as a reference line
Hi,
I'm trying to add the max count of alarms over 10 mins intervals as a reference line for a line chart. My user just wants to show the highest value on a chart whatever the selection.
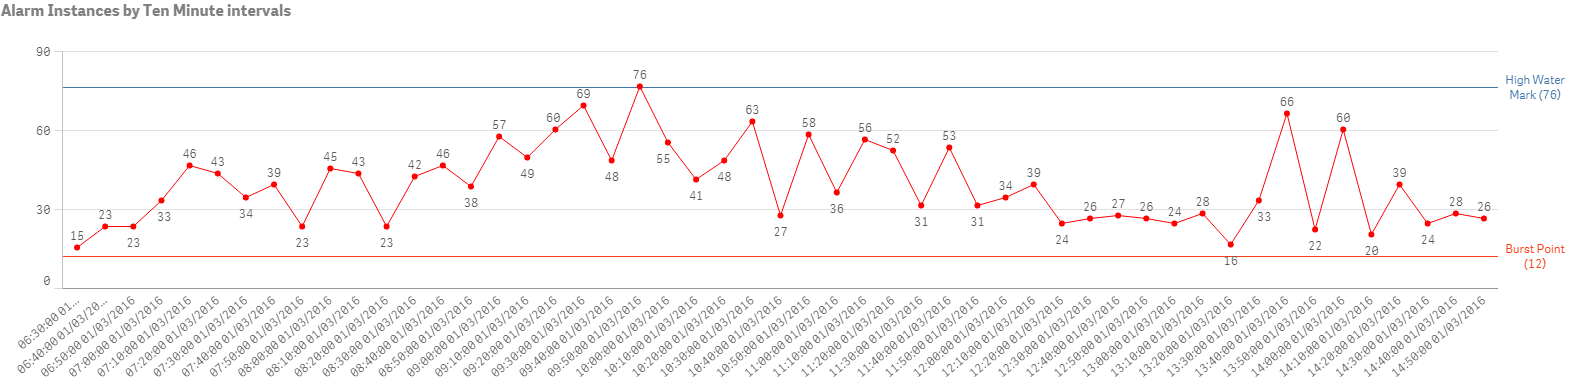
My chart has the count of alarms by Ten minute interval and Date
I'm using the expression max(aggr(count({<DataSource={'Alarms'}>} AlarmCount), TenMinInterval)).
This works if I select an individual day from my date range:
However, if I select more than one day the highest value is no longer shown:
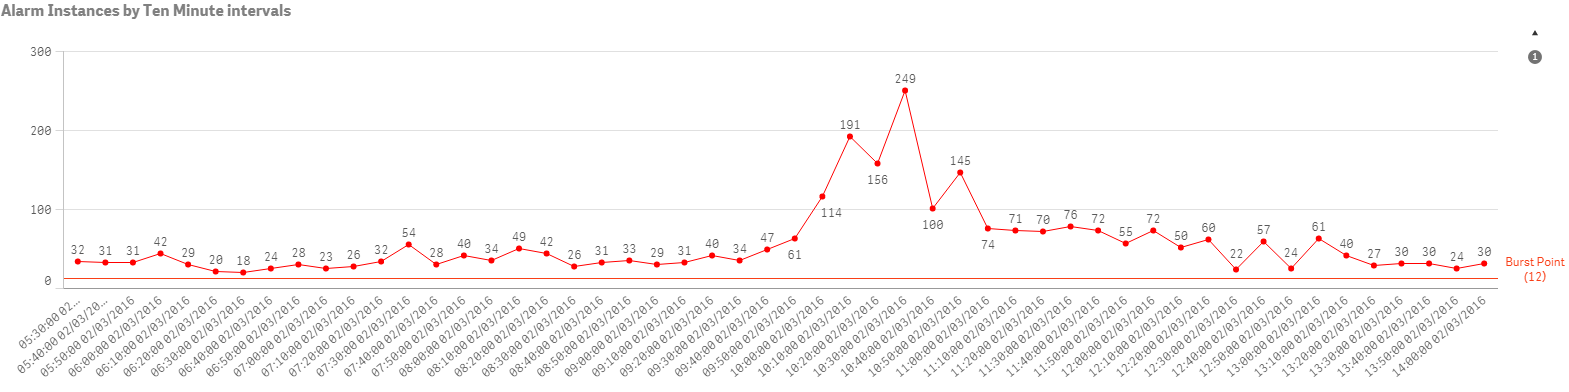
The value 249 should be the highest value in the chart, but instead its 312.
Any idea what i am doing wrong?
Cheers
Neil
- Tags:
- line chart
- max
- sense
Accepted Solutions
- Mark as New
- Bookmark
- Subscribe
- Mute
- Subscribe to RSS Feed
- Permalink
- Report Inappropriate Content
Or may be this:
=Max(TOTAL Aggr(Count({<DataSource={'Alarms'}>} AlarmCount), TenMinInterval, DateField))
- Mark as New
- Bookmark
- Subscribe
- Mute
- Subscribe to RSS Feed
- Permalink
- Report Inappropriate Content
May be
max(TOTAL aggr(count({<DataSource={'Alarms'}>} AlarmCount), TenMinInterval))
- Mark as New
- Bookmark
- Subscribe
- Mute
- Subscribe to RSS Feed
- Permalink
- Report Inappropriate Content
Hi Manish,
I’ve tried that, but it makes no difference to the value I’m afraid.
Neil
- Mark as New
- Bookmark
- Subscribe
- Mute
- Subscribe to RSS Feed
- Permalink
- Report Inappropriate Content
Try
max(TOTAL {<DataSource={'Alarms'}>} aggr(count({<DataSource={'Alarms'}>} AlarmCount), TenMinInterval))
or
max({<DataSource={'Alarms'}>} aggr(count({<DataSource={'Alarms'}>} AlarmCount), TenMinInterval))
- Mark as New
- Bookmark
- Subscribe
- Mute
- Subscribe to RSS Feed
- Permalink
- Report Inappropriate Content
Or may be this:
=Max(TOTAL Aggr(Count({<DataSource={'Alarms'}>} AlarmCount), TenMinInterval, DateField))
- Mark as New
- Bookmark
- Subscribe
- Mute
- Subscribe to RSS Feed
- Permalink
- Report Inappropriate Content
That’s it! Thanks Sunny!
- Mark as New
- Bookmark
- Subscribe
- Mute
- Subscribe to RSS Feed
- Permalink
- Report Inappropriate Content
Hi Manish,
Both give the same result, but thank you for your help! Like Sunny suggested, I needed to put in the extra Date field to calculate the max total value.
Cheers
Neil
- Mark as New
- Bookmark
- Subscribe
- Mute
- Subscribe to RSS Feed
- Permalink
- Report Inappropriate Content
Awesome, I am glad it worked. Please close the thread if you got what you were looking for by marking the correct and helpful answers.
Best,
Sunny