Unlock a world of possibilities! Login now and discover the exclusive benefits awaiting you.
- Qlik Community
- :
- Forums
- :
- Analytics
- :
- New to Qlik Analytics
- :
- syntax to color text in a calculated column
- Subscribe to RSS Feed
- Mark Topic as New
- Mark Topic as Read
- Float this Topic for Current User
- Bookmark
- Subscribe
- Mute
- Printer Friendly Page
- Mark as New
- Bookmark
- Subscribe
- Mute
- Subscribe to RSS Feed
- Permalink
- Report Inappropriate Content
syntax to color text in a calculated column
Been struggling with this....even though I'm sure the answer is v straightforward...
I have a straightforward table with a list of calculated %'s

I have introduced an additional measure that is called Movement and is calculated as follows:
"Column(2)-Column(7)" . I am now trying to come up with the syntax to make the movement Green if = > 0 and Red if <0
For some reason I cant make it work. Any help appreciated.
If it is required, the syntax for Column 2 is
If(Count({<Question={'COMM1','COMM2','COMM3','CL2'}>} Answer)<=19,'X',
Num((Sum({<Question={'COMM1','COMM2','COMM3','CL2'}>} Answer)/(Count({<Question={'COMM1','COMM2','COMM3','CL2'}>} Answer)*6)),'#,##0%'))
And for Column 7 is
If(Count({<Question={'COMM1','COMM2','COMM3','CL2'}>} Answer)<=19,'X',
Num((Sum({<[Month/Year]={"8/1/2016"}, Question={'COMM1','COMM2','COMM3','CL2'}>} Answer)
/(Count({<[Month/Year]={"8/1/2016"}, Question={'COMM1','COMM2','COMM3','CL2'}>} Answer)*6)),'#,##0%'))
Any help appreciated...
- « Previous Replies
-
- 1
- 2
- Next Replies »
Accepted Solutions
- Mark as New
- Bookmark
- Subscribe
- Mute
- Subscribe to RSS Feed
- Permalink
- Report Inappropriate Content
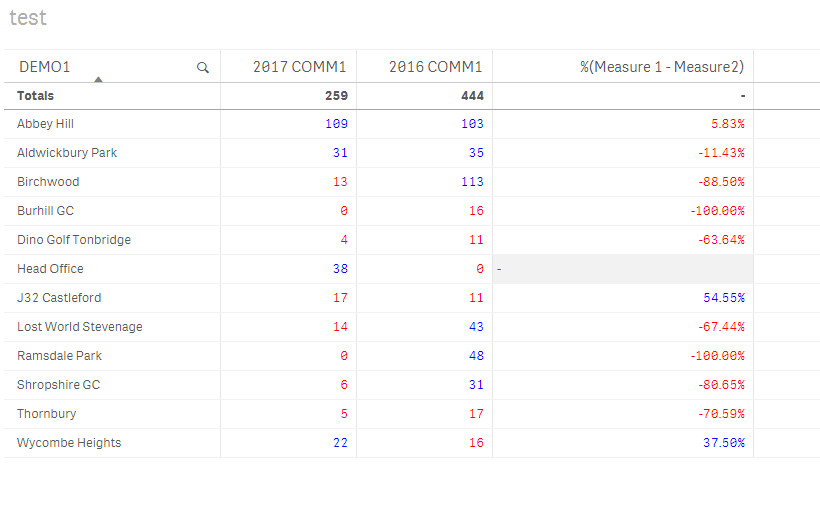
Expressions
Sum({<[Month/Year]={'8/1/2017'}>}COMM1)
Sum({<[Month/Year]={'8/1/2016'}>}COMM1)
=If(Column(2) <> 0,(Column(1) - Column(2))/Column(2), Null())
Text Color
=If(Sum({<[Month/Year]={'8/1/2017'}>}COMM1) > 20, RGB(0,0,255), RGB(255,0,0))
=If(Sum({<[Month/Year]={'8/1/2016'}>}COMM1) > 20, RGB(0,0,255), RGB(255,0,0))
=If(Column(2) <> 0, If((Column(1) - Column(2))/Column(2)*100 > 10,RGB(0, 0, 255), RGB(255, 0, 0)), Null())
- Mark as New
- Bookmark
- Subscribe
- Mute
- Subscribe to RSS Feed
- Permalink
- Report Inappropriate Content
Hi,
I'm not sure if your individual expressions are not working when you are using them in new column but I've used text color in a column and it has worked.
My expression is like following
=If($(vNewRequestExprVariations(1)) > 5, RGB(0,0,255), RGB(255,0,0))
share sample file if you are still not able to get it working.
- Mark as New
- Bookmark
- Subscribe
- Mute
- Subscribe to RSS Feed
- Permalink
- Report Inappropriate Content
I still cant do it.
Should my syntax be?
=If($(Movement)) > 0, RGB(0,0,255), RGB(255,0,0))
If not what file do I need to send?
- Mark as New
- Bookmark
- Subscribe
- Mute
- Subscribe to RSS Feed
- Permalink
- Report Inappropriate Content
No. I had a variable for my calculation. That I was using to check. I'm not sure if you have done that way. Will you be able to share your data/file. So I can try?
- Mark as New
- Bookmark
- Subscribe
- Mute
- Subscribe to RSS Feed
- Permalink
- Report Inappropriate Content
Not sure how to share raw data. and I don't think an Excel export would work.
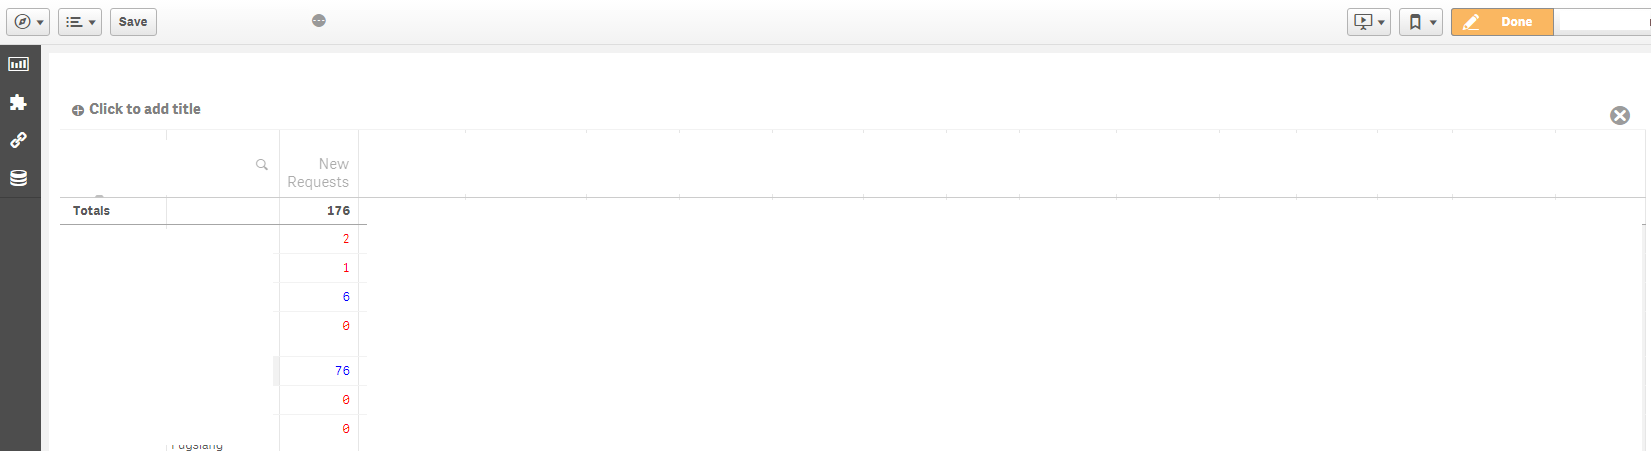
here is some "data" for the raw measures. You need to add in the syntax's above to create Columns 2 and 7
- Mark as New
- Bookmark
- Subscribe
- Mute
- Subscribe to RSS Feed
- Permalink
- Report Inappropriate Content

- Mark as New
- Bookmark
- Subscribe
- Mute
- Subscribe to RSS Feed
- Permalink
- Report Inappropriate Content
Hi Peter,
I've a meeting for next hour. I'll work on your this after that. One observation from data file and screen shot is that there is no answer column in data. I'll just try to come up with % calculation using data you have provided and color it. unless you want to share any more information. Column headers in your screen shot are not completely visible so difficult to know what those columns are.
BR,
Vijay
- Mark as New
- Bookmark
- Subscribe
- Mute
- Subscribe to RSS Feed
- Permalink
- Report Inappropriate Content
As I said was not sure what raw data to give...
The formatting I have a challenge with is really just like this:
| Communication | Communication 2016 | Movement | |
| Location 1 | 80% | 75% | 5% |
| Location 2 | 85% | 87% | -2% |
Where Movement is the Communication-Communication 2016 = Movement (difference between the 2 "%" values) . I want the movement field to be red if its negative and green if its positive.
Hopefully I can use the measure names in the syntax.
Its kind of that simple bt tying me up in knots. Thanks so much for your help
- Mark as New
- Bookmark
- Subscribe
- Mute
- Subscribe to RSS Feed
- Permalink
- Report Inappropriate Content
 Please see attached
- Mark as New
- Bookmark
- Subscribe
- Mute
- Subscribe to RSS Feed
- Permalink
- Report Inappropriate Content
That looks perfect I just need to figure out how to open the QVF file.
- « Previous Replies
-
- 1
- 2
- Next Replies »