Unlock a world of possibilities! Login now and discover the exclusive benefits awaiting you.
- Qlik Community
- :
- Forums
- :
- Analytics
- :
- App Development
- :
- Calculate percentage of grand total
- Subscribe to RSS Feed
- Mark Topic as New
- Mark Topic as Read
- Float this Topic for Current User
- Bookmark
- Subscribe
- Mute
- Printer Friendly Page
- Mark as New
- Bookmark
- Subscribe
- Mute
- Subscribe to RSS Feed
- Permalink
- Report Inappropriate Content
Calculate percentage of grand total
I have a data modal like the printscreen below:
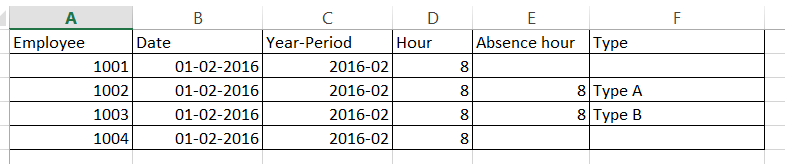
Now I want to show the absence percentage per Year-period / Type
The total absence for period 2016-02 is 50% and per type is 25%.
In my barchart I have 2 dimensions: Year-Period and Type and 1 measure something like Sum(Absence hour) / Sum(Hour).
The problem is the bar chart always show 100% because it devides 16 by 16 or 8 by 8.
How can I make my bar chart it shows 50% in 2 dimensions (Type) of each 25%? I would like to devide Type (=8) by total hours (=32). I can not make this work. Can someone point me in a good direction?
Accepted Solutions
- Mark as New
- Bookmark
- Subscribe
- Mute
- Subscribe to RSS Feed
- Permalink
- Report Inappropriate Content
- Mark as New
- Bookmark
- Subscribe
- Mute
- Subscribe to RSS Feed
- Permalink
- Report Inappropriate Content
May be this:
Sum(Absence hour) / Sum(TOTAL <Year-Period> Hour)
- Mark as New
- Bookmark
- Subscribe
- Mute
- Subscribe to RSS Feed
- Permalink
- Report Inappropriate Content
That's it! How simple.
Many thanx!