Unlock a world of possibilities! Login now and discover the exclusive benefits awaiting you.
- Qlik Community
- :
- Forums
- :
- Analytics
- :
- App Development
- :
- Filter with measures like values. Select a measure
- Subscribe to RSS Feed
- Mark Topic as New
- Mark Topic as Read
- Float this Topic for Current User
- Bookmark
- Subscribe
- Mute
- Printer Friendly Page
- Mark as New
- Bookmark
- Subscribe
- Mute
- Subscribe to RSS Feed
- Permalink
- Report Inappropriate Content
Filter with measures like values. Select a measure
Hello.
I would like create a filter where I could choose between several measures, with the end to show in a pivot table or chart only a measure or other.
In this moment, I have this:
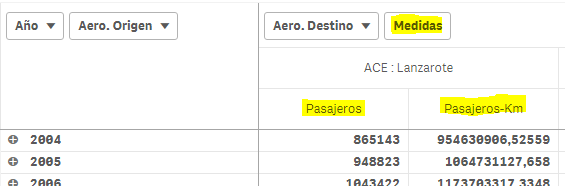
In this table, to different of a dimensions, the measures (Medidas) can not be selected. So always "Pasajeros" and "Pasajeros-km" are showed.
I can't want unpivot the table. So that isn't a option.
Is posible create a table with the measures and link with actual table?
Can someone help me?
Thanks and regards.
- Mark as New
- Bookmark
- Subscribe
- Mute
- Subscribe to RSS Feed
- Permalink
- Report Inappropriate Content
Yes, you can add an extra table in your script with the expressions:
Measures:
LOAD * INLINE [
Label, Expression
Sum of Sales, sum(Sales)
Average Sales, avg(Sales)
];
After reloading you can add a filter pane in your app for the Label field. And change the measure in your pivot table with =$(=Only(Expression)) as expression and =Only(Label) as the label
talk is cheap, supply exceeds demand
- Mark as New
- Bookmark
- Subscribe
- Mute
- Subscribe to RSS Feed
- Permalink
- Report Inappropriate Content
Hello.
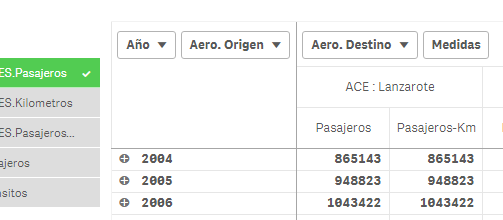
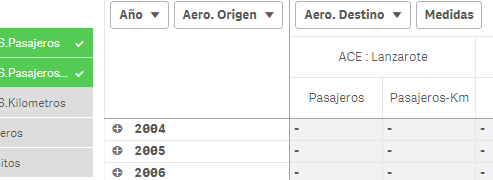
Thanks by your answer. But It don't work like I hope. Now when I choose one option, this is duplicate (obvious), and when I choose 2 or more, nothing.
The label isn't changed.
And
Is posible have the both columns (or any), and one of them hide/show when I choose a mesaure? Like when you select a opcion in a filter by dimension.
Thank you and regards.
- Mark as New
- Bookmark
- Subscribe
- Mute
- Subscribe to RSS Feed
- Permalink
- Report Inappropriate Content
Hi Gysbert,
This was very helpful for something I'm working on. Is there any way to set this up to where a user could select multiple labels and it would sum all of them rather than it only working when one is selected? My example would be that a user would be looking to combine certain types of cost like pharmacy cost, non pharmacy supply cost, salaries etc.?
Thanks for your help!
Matt