Unlock a world of possibilities! Login now and discover the exclusive benefits awaiting you.
- Qlik Community
- :
- Forums
- :
- Analytics
- :
- App Development
- :
- How to heck if value exists in another table to cr...
Options
- Subscribe to RSS Feed
- Mark Topic as New
- Mark Topic as Read
- Float this Topic for Current User
- Bookmark
- Subscribe
- Mute
- Printer Friendly Page
Turn on suggestions
Auto-suggest helps you quickly narrow down your search results by suggesting possible matches as you type.
Showing results for
Contributor III
2018-10-09
10:15 PM
- Mark as New
- Bookmark
- Subscribe
- Mute
- Subscribe to RSS Feed
- Permalink
- Report Inappropriate Content
How to heck if value exists in another table to create a pie chart?
Hi all,
I have two tables:
Table X:
| Name |
| A |
| B |
| C |
Table Y:
| Name |
| C |
| D |
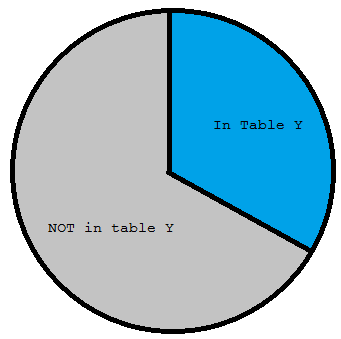
I would like to create a pie chart showing what value in Table X presents in Table Y: In above cases, C is present in Table Y while A,B are not. So the pie chart will look like below: we have 33% values in Table X present in Table Y.
How will I achive this either through manipulation in initial loading OR through calculated dimension or expressions in chart UI? (I prefer to do it in UI because the actual table is really large and I do not want to mess it up with each other during loading)
Many thanks,
Sherrie
271 Views
0 Replies
Community Browser