Unlock a world of possibilities! Login now and discover the exclusive benefits awaiting you.
- Qlik Community
- :
- Forums
- :
- Analytics
- :
- App Development
- :
- How to mix a straight table with a pivot table?
- Subscribe to RSS Feed
- Mark Topic as New
- Mark Topic as Read
- Float this Topic for Current User
- Bookmark
- Subscribe
- Mute
- Printer Friendly Page
- Mark as New
- Bookmark
- Subscribe
- Mute
- Subscribe to RSS Feed
- Permalink
- Report Inappropriate Content
How to mix a straight table with a pivot table?
Hi,
I am using Qlik Sense Desktop and I need to have a report that mixes a straight table with a pivot table and to look like this:
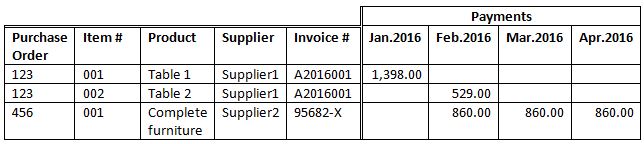
The left part has fixed columns (for reporting proposes I do not want drill-down format), and the right side will have to be dynamic adjusting to the periods that I have movements for each specific project.
Is there any way to achieve it?
Thank you,
Rui
- Mark as New
- Bookmark
- Subscribe
- Mute
- Subscribe to RSS Feed
- Permalink
- Report Inappropriate Content
What's the issue with just using a pivot table alone? Would you be able to share a sample to try this out in Qlik Sense?
- Mark as New
- Bookmark
- Subscribe
- Mute
- Subscribe to RSS Feed
- Permalink
- Report Inappropriate Content
Sunny,
TY for your answer.
A pivot table does not have the left part as a flat table, but as a hierarchical structure which makes more difficult to read with large data sets and easily becomes very large.
What I am looking for is the compactness of the table format (at the left), associated with the flexibility of the pivot table at the right.
The example I presented above can be set as:
LOAD * INLINE [
Po, item, product, supplier, invoice, date, value
123, ‘001’, ‘Table 1’, “Supplier 1”, ‘A2016001’, 15012016, 1398
123, ‘002’, ‘Table 2’, “Supplier 1”, ‘A2016001’, 02022016, 529
456, ‘001’, “Complete furniture”, “Supplier 2”, ‘95682X’, 13022016, 860
456, ‘001’, “Complete furniture”, “Supplier 2”, ‘95682X’, 13032016, 860
456, ‘001’, “Complete furniture”, “Supplier 2”, ‘95682X’, 13042016, 860 ];
- Mark as New
- Bookmark
- Subscribe
- Mute
- Subscribe to RSS Feed
- Permalink
- Report Inappropriate Content
Just a thought , use Pivot table and in the properties for the pivot table -> presentation -> Uncheck the Indent rows.. That will give the structure you are looking for.