Unlock a world of possibilities! Login now and discover the exclusive benefits awaiting you.
- Qlik Community
- :
- Forums
- :
- Analytics
- :
- App Development
- :
- Re: Line chart preview is always left-centered?
- Subscribe to RSS Feed
- Mark Topic as New
- Mark Topic as Read
- Float this Topic for Current User
- Bookmark
- Subscribe
- Mute
- Printer Friendly Page
- Mark as New
- Bookmark
- Subscribe
- Mute
- Subscribe to RSS Feed
- Permalink
- Report Inappropriate Content
Line chart preview is always left-centered?
Hi!
I have a few line charts displaying measures over time where the time stamps are quite a few. Here is a preview of how they look in my Qlik Sense app:
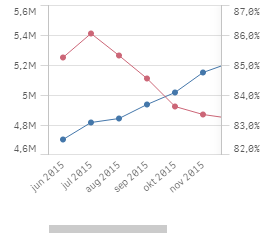
As you can see the scroll is positioned at the left and my most relevant data is to the right (latest time stamps).
Is there any way to make the scroll positioned to the right? I don't want to invert the time axis as this would IMO make reading less intuitive.
- Tags:
- line chart
- Mark as New
- Bookmark
- Subscribe
- Mute
- Subscribe to RSS Feed
- Permalink
- Report Inappropriate Content
Afaik this is not possible. Perhaps limiting the chart initially to the last six months is an option.
talk is cheap, supply exceeds demand
- Mark as New
- Bookmark
- Subscribe
- Mute
- Subscribe to RSS Feed
- Permalink
- Report Inappropriate Content
That should work, I however decided to change the dimension to quarters of a year instead om months, leaving months to an alternative dimension. Thanks anyway!