Unlock a world of possibilities! Login now and discover the exclusive benefits awaiting you.
- Qlik Community
- :
- All Forums
- :
- QlikView Administration
- :
- Help
- Subscribe to RSS Feed
- Mark Topic as New
- Mark Topic as Read
- Float this Topic for Current User
- Bookmark
- Subscribe
- Mute
- Printer Friendly Page
- Mark as New
- Bookmark
- Subscribe
- Mute
- Subscribe to RSS Feed
- Permalink
- Report Inappropriate Content
Help
Hi Team,
I am stuck in one requirement which is not able to implement by me. I need your help here.
my requirement is :-
we have four fields in our spreadsheet:-
1. Division
2. Year
3. Revenue
4. Category
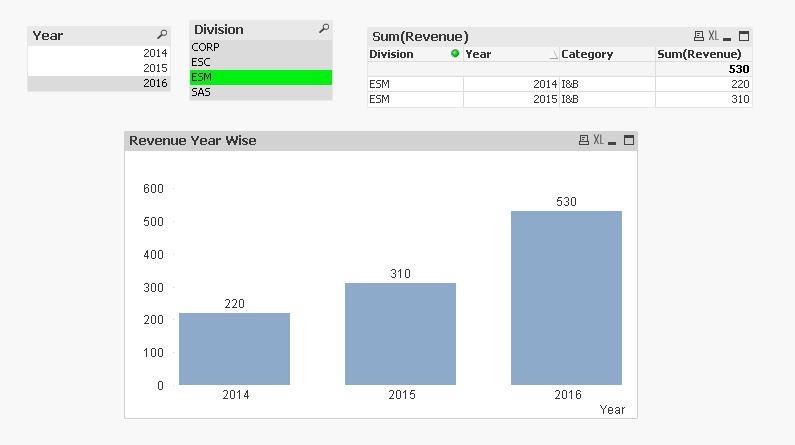
in Division field , we have 4 values(CORP,ESM,SAS,ESC) And Year value is {2014,2015 and 2016} with revenue amount is given.
But For "ESM Division" , we are not getting the "2016" year and revenue value data from spreadsheet data. And i want to show the revenue amount for "ESM Division" for 2016 year in qlikview which is the cumulative Revenue value of 2015 and 2014.
And when i select ESM Division as selection filter, then In Bar Chart ..Three BAR Piece should be shown :- one is for 2014 , 2nd is for 2015 and third is for 2016(which would be the cumulative revenue amount of 2014 and 2015 year).
Also i have attached the spreadsheet for the same data.
please check and help me over this.
Thanks
Gourav
- Tags:
- qlikview_deployment
- Mark as New
- Bookmark
- Subscribe
- Mute
- Subscribe to RSS Feed
- Permalink
- Report Inappropriate Content
May be as attached:
Data:
LOAD Year,
Division,
Revenue,
Category
FROM
(ooxml, embedded labels, table is Sheet1);
Join
Load
'2016' as Year,
'ESM' as Division,
'I&B' as Category,
Sum(Revenue) as Revenue
Resident Data
Where Division = 'ESM';
- Mark as New
- Bookmark
- Subscribe
- Mute
- Subscribe to RSS Feed
- Permalink
- Report Inappropriate Content
Hi
This is static code . Can you tell me how tto make it dynamic
- Mark as New
- Bookmark
- Subscribe
- Mute
- Subscribe to RSS Feed
- Permalink
- Report Inappropriate Content
Hi Gourav,
Please see attached QVW , hopefully this helps you.
TAB_MAX_YEAR:
LOAD max(Year) as MAXYEAR
FROM
(ooxml, embedded labels, table is Sheet1);
Let vMaxYear = NUM(Peek('MAXYEAR',0,'TAB_MAX_YEAR'));
LOAD Year,
Division,
Category,
Revenue
FROM
(ooxml, embedded labels, table is Sheet1)
Where Year < $(vMaxYear);
CONCATENATE
LOAD $(vMaxYear) as Year,
Division,
Category,
SUM(Revenue) as Revenue
FROM
(ooxml, embedded labels, table is Sheet1)
Where Year < $(vMaxYear)
Group By
Division,
Category;
If a post helps to resolve your issue, please accept it as a Solution.
- Mark as New
- Bookmark
- Subscribe
- Mute
- Subscribe to RSS Feed
- Permalink
- Report Inappropriate Content
May be like this -
- Mark as New
- Bookmark
- Subscribe
- Mute
- Subscribe to RSS Feed
- Permalink
- Report Inappropriate Content
Hi Sir,
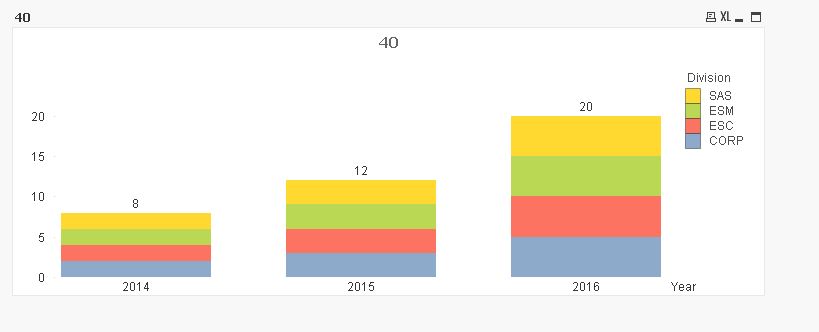
Suppose in place of revenue we have employee id. and count of employee id for max year show 1..But i want to cumulative count of 2014 and 2015 employee id..how is it possible...kindly help me for solving this requirement.
- Mark as New
- Bookmark
- Subscribe
- Mute
- Subscribe to RSS Feed
- Permalink
- Report Inappropriate Content
I've made my own sample data, hope it helps.
TAB_MAX_YEAR:
LOAD max(Year) as MAXYEAR
FROM
(ooxml, embedded labels, table is Sheet1);
Let vMaxYear = NUM(Peek('MAXYEAR',0,'TAB_MAX_YEAR'));
EMPID_COUNT:
LOAD Distinct EmpID,
Year,
Division,
Category,
1 as EMPCOUNT
FROM
(ooxml, embedded labels, table is Sheet1)
Where Year < $(vMaxYear);
CONCATENATE
LOAD $(vMaxYear) as Year,
Division,
Category,
SUM(EMPCOUNT) as EMPCOUNT
RESIDENT EMPID_COUNT
Where Year < $(vMaxYear)
Group By
Division,
Category;
If a post helps to resolve your issue, please accept it as a Solution.
- Mark as New
- Bookmark
- Subscribe
- Mute
- Subscribe to RSS Feed
- Permalink
- Report Inappropriate Content
Hi Sir,
This is sum of employee id...But i want to count of employee id..
- Mark as New
- Bookmark
- Subscribe
- Mute
- Subscribe to RSS Feed
- Permalink
- Report Inappropriate Content
In Above Your Example Division corp against employee id in 2016 cumulative count of 2014 or 2015....it should be 21 for corp division.selecting year 2016
- Mark as New
- Bookmark
- Subscribe
- Mute
- Subscribe to RSS Feed
- Permalink
- Report Inappropriate Content
Ok, now i think i know what you need.
Please refer to the original attachment I provided for summarizing revenue and try replicating the same for Emp, the concept is the same.
If you get stuck please post a sample app or data in a new thread.
If a post helps to resolve your issue, please accept it as a Solution.