Unlock a world of possibilities! Login now and discover the exclusive benefits awaiting you.
- Qlik Community
- :
- All Forums
- :
- QlikView Administration
- :
- QlikView Server doesn't take advantage of multiple...
- Subscribe to RSS Feed
- Mark Topic as New
- Mark Topic as Read
- Float this Topic for Current User
- Bookmark
- Subscribe
- Mute
- Printer Friendly Page
- Mark as New
- Bookmark
- Subscribe
- Mute
- Subscribe to RSS Feed
- Permalink
- Report Inappropriate Content
QlikView Server doesn't take advantage of multiple cores
Hello all,
Documentation states that "QlikView scales almost perfectly with the addition of more cores and more CPUs".
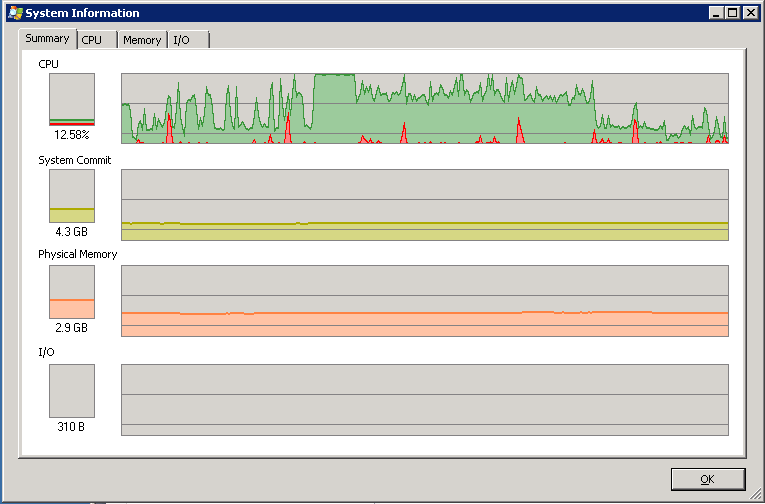
However, our QV11 server seems to use only one CPU (green graph in the attached image) reaching a "server timeout" response when it takes too much time, while the other CPU remains almost idle (red graph).
Could somebody give us advice about why is this happening?
- « Previous Replies
-
- 1
- 2
- Next Replies »
- Mark as New
- Bookmark
- Subscribe
- Mute
- Subscribe to RSS Feed
- Permalink
- Report Inappropriate Content
Hi,
Is there any chance that the chart that throws that server timeout has one or several Count DISTINCT or Aggr() functions within them? That can be the cause.
By the way, does the CPU behaves like that with any document of QlikView?
Hope that helps.
Miguel
- Mark as New
- Bookmark
- Subscribe
- Mute
- Subscribe to RSS Feed
- Permalink
- Report Inappropriate Content
Hola Miguel, thank you,
There are just a couple of aggr(count(distinct... used as expressions in list boxes, and some getSelectedCount(). There are also a lot of nested ifs. Do you think these could be a problem?
I'm going to check the just-one-core usage is happening with other QlikView documents.
- Mark as New
- Bookmark
- Subscribe
- Mute
- Subscribe to RSS Feed
- Permalink
- Report Inappropriate Content
Hi,
Yes, definitely that can be one issue. Try moving those nested If() to different objects (having many with different expressions instead of one with one single big expression).
Anyway, let's see what happens to other QVW files.
Hope that helps.
Miguel
- Mark as New
- Bookmark
- Subscribe
- Mute
- Subscribe to RSS Feed
- Permalink
- Report Inappropriate Content
Hello,
Other QVW files use only one core too, while the other is almost idle. So I really would like to understand why and make use of the two cores (and possibly get more cores to get rid of the "server timeout").
About the nested ifs, I think it's going to be very difficult to redesign the QVW, so I would prefer to solve the core issue first.
- Mark as New
- Bookmark
- Subscribe
- Mute
- Subscribe to RSS Feed
- Permalink
- Report Inappropriate Content
Hi,
We are experiencing the same thing and would be a great help for any advice as well.
We have a machine with 8xquad core (32) cpu with 256MB RAM. and we tested a qvw with 5 users, and we found that we are using one CPU.
The QV process is not utilizing the server resource available.
Any suggestion would be great.
Thanks
David
- Mark as New
- Bookmark
- Subscribe
- Mute
- Subscribe to RSS Feed
- Permalink
- Report Inappropriate Content
Hi,
If the issue is in the functions used, then there is no "core issue", because what is causing the bad performance are the expressions in the charts.
Try doing a binary load from that file to an empty one, and move some of the charts (not all of them) to see where is the issue.
Hope that helps.
Miguel
- Mark as New
- Bookmark
- Subscribe
- Mute
- Subscribe to RSS Feed
- Permalink
- Report Inappropriate Content
Hello,
You are right Miguel, I think the core issue wasn't there, I think I checked wrongly the task manager. To David Cheung below me: recheck your task manager, you were probably using all the cores and by mistake you thought that you weren't, just like me.
I'll check the different charts and expressions.
- Mark as New
- Bookmark
- Subscribe
- Mute
- Subscribe to RSS Feed
- Permalink
- Report Inappropriate Content
Hi Alzhaid, and Miguel,
We have raised this with QT, and waiting for a response on this.
We are in the midst of 'peeling the onion', layer by layer.
We have found that the Set Analysis is performing at Multi-Core CPU.
What we are now tracing is why we have a wait period before the calculation starts to perform.
This is a good exercise!... ![]()
David
- Mark as New
- Bookmark
- Subscribe
- Mute
- Subscribe to RSS Feed
- Permalink
- Report Inappropriate Content
Hi,
We have found the problem the cause of the problem, it's the way expression becomes a the 'single-thread' chain reaction.
Thanks for the pointer.
David
- « Previous Replies
-
- 1
- 2
- Next Replies »