Unlock a world of possibilities! Login now and discover the exclusive benefits awaiting you.
- Qlik Community
- :
- All Forums
- :
- QlikView App Dev
- :
- 12 Month Rolling Average Query
- Subscribe to RSS Feed
- Mark Topic as New
- Mark Topic as Read
- Float this Topic for Current User
- Bookmark
- Subscribe
- Mute
- Printer Friendly Page
- Mark as New
- Bookmark
- Subscribe
- Mute
- Subscribe to RSS Feed
- Permalink
- Report Inappropriate Content
12 Month Rolling Average Query
Hello Everyone,
I am trying to do a 12 month rolling average with the chart below.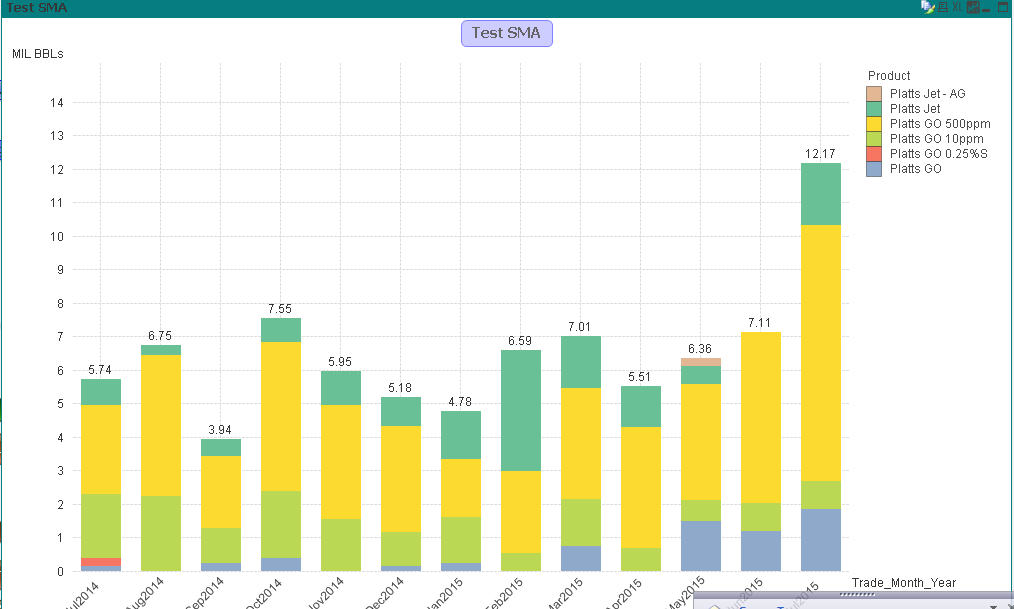
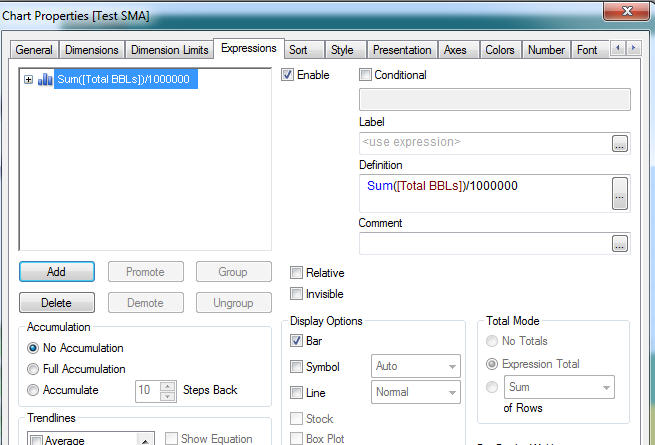
See below Expression I used to generate above chart. How do I do a 12 months rolling AVG for above chart please?
Thanks tons in advance!!
- Mark as New
- Bookmark
- Subscribe
- Mute
- Subscribe to RSS Feed
- Permalink
- Report Inappropriate Content
Try this may be:
RangeAvg(Above(Sum([Total BBLs])/1000000, 0, 12))
- Mark as New
- Bookmark
- Subscribe
- Mute
- Subscribe to RSS Feed
- Permalink
- Report Inappropriate Content
The chart splits into different products(Dubai, Oman etc) when I added that Expression. So does not work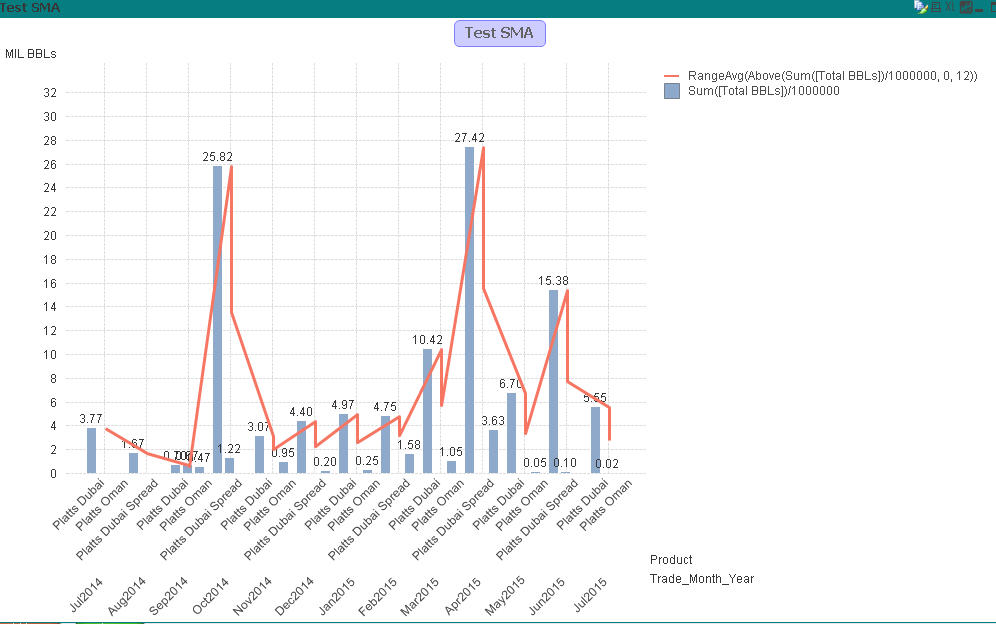
- Mark as New
- Bookmark
- Subscribe
- Mute
- Subscribe to RSS Feed
- Permalink
- Report Inappropriate Content
If you want it to be 12 Month Average of all products together, you might need this:
=RangeAvg(Above(Aggr(Sum([Total BBLs])/1000000, Trade_Month_Year), 0, 12))
- Mark as New
- Bookmark
- Subscribe
- Mute
- Subscribe to RSS Feed
- Permalink
- Report Inappropriate Content
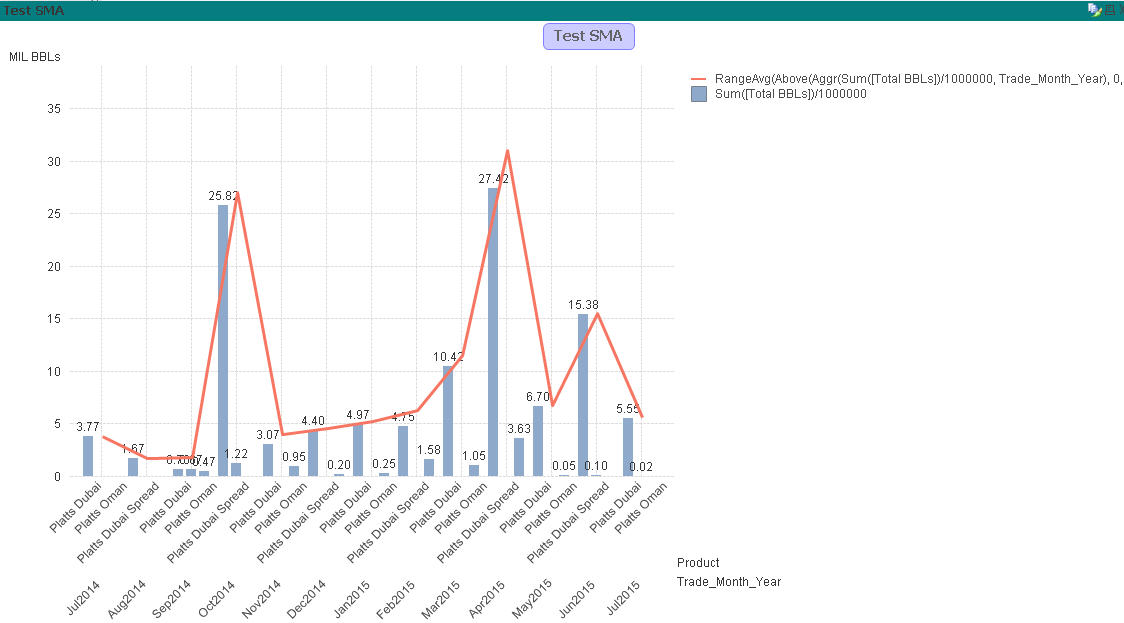
Got below chart, chart still splitting the products.
- Mark as New
- Bookmark
- Subscribe
- Mute
- Subscribe to RSS Feed
- Permalink
- Report Inappropriate Content
It is possible that I need to change my the other Expression so that my bar charts will not split? see below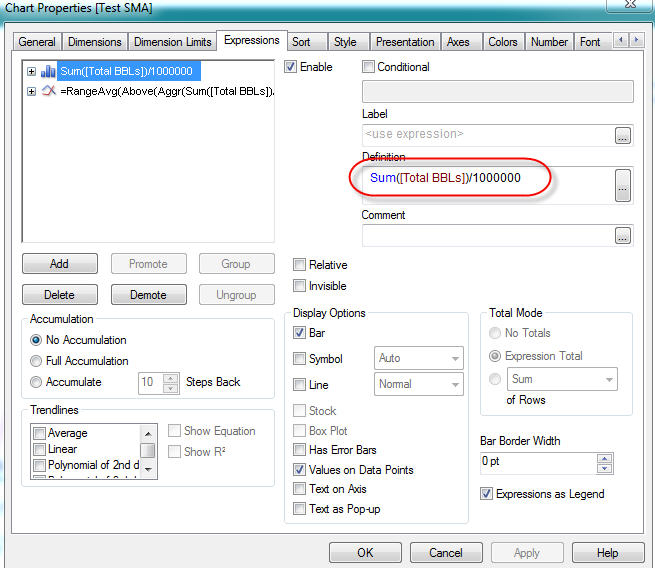
- Mark as New
- Bookmark
- Subscribe
- Mute
- Subscribe to RSS Feed
- Permalink
- Report Inappropriate Content
I don't think you can combine a stacked bar (stacked via dimension) with a line on a second expression. The line forces the second dimension onto the axis.