Unlock a world of possibilities! Login now and discover the exclusive benefits awaiting you.
- Qlik Community
- :
- All Forums
- :
- QlikView App Dev
- :
- A Chart
- Subscribe to RSS Feed
- Mark Topic as New
- Mark Topic as Read
- Float this Topic for Current User
- Bookmark
- Subscribe
- Mute
- Printer Friendly Page
- Mark as New
- Bookmark
- Subscribe
- Mute
- Subscribe to RSS Feed
- Permalink
- Report Inappropriate Content
A Chart
Hi to All
How to get a PipeLine Chart with ONE Dimension and with ONE Measure ?
Thanks in Advance
Tahemas Momin
- « Previous Replies
-
- 1
- 2
- Next Replies »
Accepted Solutions
- Mark as New
- Bookmark
- Subscribe
- Mute
- Subscribe to RSS Feed
- Permalink
- Report Inappropriate Content
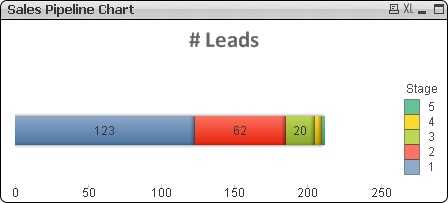
Create a simple bar chart, rotate it 90deg and plot data values inside segments. Like this:

- Mark as New
- Bookmark
- Subscribe
- Mute
- Subscribe to RSS Feed
- Permalink
- Report Inappropriate Content
Load your data into your document, select Chart->Funnel chart, add your dimension, create a single expression and click OK.
- Mark as New
- Bookmark
- Subscribe
- Mute
- Subscribe to RSS Feed
- Permalink
- Report Inappropriate Content
"Funnel chart" is the fourth icon on the second row of Chart properties->General->Chart type.
- Mark as New
- Bookmark
- Subscribe
- Mute
- Subscribe to RSS Feed
- Permalink
- Report Inappropriate Content
Thanks
But Actually I want a Funnel Chart in the form of Line Chart
Is it Possible?
Regards
Tahemas Momin
- Mark as New
- Bookmark
- Subscribe
- Mute
- Subscribe to RSS Feed
- Permalink
- Report Inappropriate Content
Can you post an example or a screenshot of what you want the Funnel chart to look like? Thanks.
- Mark as New
- Bookmark
- Subscribe
- Mute
- Subscribe to RSS Feed
- Permalink
- Report Inappropriate Content
It is Highely Confidential
so PLEASE can you take the Sample data of Qlik ?
Regards
Tahemas Momin
- Mark as New
- Bookmark
- Subscribe
- Mute
- Subscribe to RSS Feed
- Permalink
- Report Inappropriate Content
I don't think so because combination of funnel chart and Line chart available in qlikview. May be go for extension if you feel to work on extensions
- Mark as New
- Bookmark
- Subscribe
- Mute
- Subscribe to RSS Feed
- Permalink
- Report Inappropriate Content
I don't need example data, I need an impression of what the chart should look like (a screenshot will do). You can create an example chart in Excel, if that's easier for you.
- Mark as New
- Bookmark
- Subscribe
- Mute
- Subscribe to RSS Feed
- Permalink
- Report Inappropriate Content
You can draw the chart in Paint as per your requirement , so that we will get some idea
- Mark as New
- Bookmark
- Subscribe
- Mute
- Subscribe to RSS Feed
- Permalink
- Report Inappropriate Content
Hi Please have a look on Snap Shot

Regards
Tahemas Momin
- « Previous Replies
-
- 1
- 2
- Next Replies »