Unlock a world of possibilities! Login now and discover the exclusive benefits awaiting you.
- Qlik Community
- :
- All Forums
- :
- QlikView App Dev
- :
- ABC Cross analysis
- Subscribe to RSS Feed
- Mark Topic as New
- Mark Topic as Read
- Float this Topic for Current User
- Bookmark
- Subscribe
- Mute
- Printer Friendly Page
- Mark as New
- Bookmark
- Subscribe
- Mute
- Subscribe to RSS Feed
- Permalink
- Report Inappropriate Content
ABC Cross analysis
Hi guys,
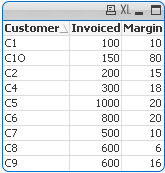
I'm trying to figure out how to show a dynamic calculated ABC Cross analysis (by Invoiced value and Margin Value) in the same table. In the attached file you can find a simple example with sample data as below:

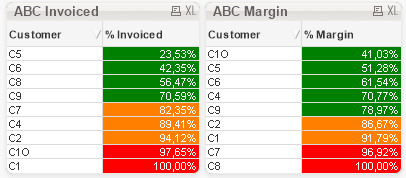
I'm able to show ABC Analysis into two different tables:

I'm not able to show the above percentages in the same table because Percentage values are cumulative values based on a specific order (in first table by "Invoiced value" and in the second one by "Margin Value"
I can't calculate the percentage before loading values because all the values have to be dynamically calculated based on current filters.
attached you can find the source qvw file with all the data loaded
Any Ideas ?
Thank you
- Mark as New
- Bookmark
- Subscribe
- Mute
- Subscribe to RSS Feed
- Permalink
- Report Inappropriate Content
How do you compute %invoice, %Margin
with words, an equation ...
Fabrice
- Mark as New
- Bookmark
- Subscribe
- Mute
- Subscribe to RSS Feed
- Permalink
- Report Inappropriate Content
The formula is:
(rangesum(above(sum(Invoiced),0,rowno())))/sum(Total Invoiced)
In other words every row shows the actual and above Invoice values
same story for the Margin
- Mark as New
- Bookmark
- Subscribe
- Mute
- Subscribe to RSS Feed
- Permalink
- Report Inappropriate Content
Hi,
I've not a solution but the problem is due to the above function, in fact you have two different sort by invoice/margin. In your case, sorting by invioce, the above is not correct for the margin.
- Mark as New
- Bookmark
- Subscribe
- Mute
- Subscribe to RSS Feed
- Permalink
- Report Inappropriate Content
Yes, that's the problem.. I'm thinking if a set analysis can be a way.
Do you think could be a solution to use a set analysis (independent of current dimension) with condition Margin<= current row margin (should be a kind of a order simulated by a set analysis).