Unlock a world of possibilities! Login now and discover the exclusive benefits awaiting you.
- Qlik Community
- :
- All Forums
- :
- QlikView App Dev
- :
- Accumulate data for missing months
- Subscribe to RSS Feed
- Mark Topic as New
- Mark Topic as Read
- Float this Topic for Current User
- Bookmark
- Subscribe
- Mute
- Printer Friendly Page
- Mark as New
- Bookmark
- Subscribe
- Mute
- Subscribe to RSS Feed
- Permalink
- Report Inappropriate Content
Accumulate data for missing months
Hi I have a question, I have to create an accumulated bar chart. I have a data up to April 2017 for HR dept but I only have March 2017 data for IT dept. I would like to show month of april in the IT chart even if i dont have the data. I just want to show the up to date data. Thank you in advance for the help.
Accepted Solutions
- Mark as New
- Bookmark
- Subscribe
- Mute
- Subscribe to RSS Feed
- Permalink
- Report Inappropriate Content
Check 'Show All Value' on Dimension tab AND uncheck 'Suppress Zero Value' on presentation tab.
- Mark as New
- Bookmark
- Subscribe
- Mute
- Subscribe to RSS Feed
- Permalink
- Report Inappropriate Content
I'm sorry,the data for IT dept is until Feb 2017 only
- Mark as New
- Bookmark
- Subscribe
- Mute
- Subscribe to RSS Feed
- Permalink
- Report Inappropriate Content
I didn't follow you properly. Can you share expected result?
- Mark as New
- Bookmark
- Subscribe
- Mute
- Subscribe to RSS Feed
- Permalink
- Report Inappropriate Content
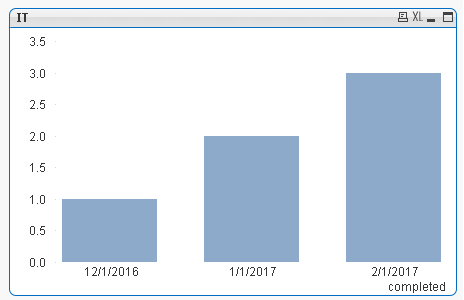
Hi apologies, I would like this table:

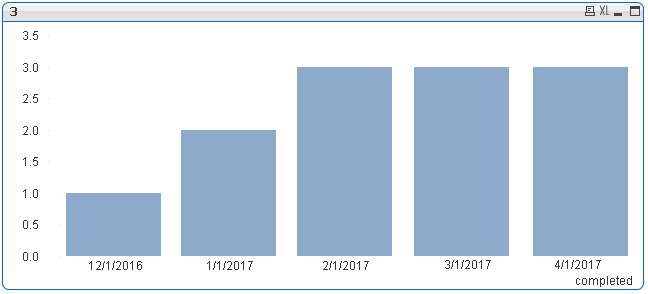
to show this way:

I just want the user to see that as of april, there are total of 3 completed training.
- Mark as New
- Bookmark
- Subscribe
- Mute
- Subscribe to RSS Feed
- Permalink
- Report Inappropriate Content
It's still these reports there in QVW. What you are looking for? May be show in Straight table or excel file which is output need?
- Mark as New
- Bookmark
- Subscribe
- Mute
- Subscribe to RSS Feed
- Permalink
- Report Inappropriate Content
Check 'Show All Value' on Dimension tab AND uncheck 'Suppress Zero Value' on presentation tab.